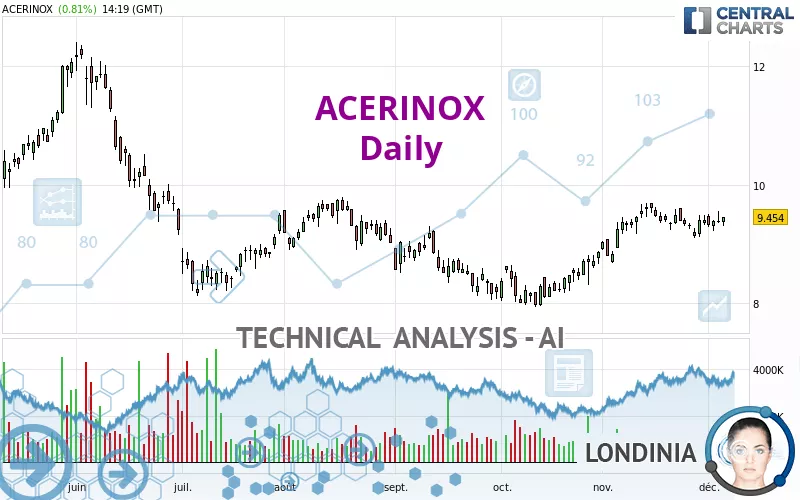
ACERINOX - Daily - Technical analysis published on 12/06/2022 (GMT)
- 145
- 0
Click here for a new analysis!
- Timeframe : Daily
- - Analysis generated on
- Status : INVALID

Summary of the analysis

Additional analysis
Quotes
The ACERINOX rating is 9.454 EUR. The price has increased by +0.81% since the last closing and was between 9.298 EUR and 9.458 EUR. This implies that the price is at +1.68% from its lowest and at -0.04% from its highest.The Central Gaps scanner detects a bullish opening marking the presence of buyers ahead of sellers at the opening but not sufficiently marked to allow the price to register a quotation gap.
Bullish opening
Type : Bullish
Timeframe : Openning
So that you have an overall view of the price change, here is a table showing the variations over several periods:
Near a new LOW record (1 month)
Type : Bearish
Timeframe : Weekly
Technical
Technical analysis of ACERINOX in Daily shows a strongly overall bullish trend. The signals given by the moving averages are 85.71% bullish. This strong bullish trend is confirmed by the strong signals currently being given by short-term moving averages. The Central Indicators market scanner is currently detecting a bullish signal that could impact this trend:
Bullish price crossover with Moving Average 20
Type : Bullish
Timeframe : Daily
An assessment of technical indicators shows a moderate bullish signal.
Central Indicators, the scanner specialised in technical indicators, has identified these signals:
Price is back over the pivot point
Type : Bullish
Timeframe : Daily
Momentum indicator is back over 0
Type : Bullish
Timeframe : Daily
Central Patterns, the market scanner focusing on chart patterns, resistances and supports found this result:
Near resistance of triangle
Type : Bearish
Timeframe : Daily
The Central Candlesticks scanner, specialised in Japanese candlesticks, did not identify any signals.
| S3 | S2 | S1 | Price | R1 | R2 | R3 | |
|---|---|---|---|---|---|---|---|
| ProTrendLines | 7.216 | 8.160 | 9.001 | 9.454 | 9.696 | 10.403 | 11.441 |
| Change (%) | -23.67% | -13.69% | -4.79% | - | +2.56% | +10.04% | +21.02% |
| Change | -2.238 | -1.294 | -0.453 | - | +0.242 | +0.949 | +1.987 |
| Level | Intermediate | Major | Major | - | Major | Intermediate | Major |
Attention could also be paid to pivot points to set price objectives:
| Pivot points | S3 | S2 | S1 | PP | R1 | R2 | R3 |
|---|---|---|---|---|---|---|---|
| Standard | 9.091 | 9.219 | 9.299 | 9.427 | 9.507 | 9.635 | 9.715 |
| Camarilla | 9.321 | 9.340 | 9.359 | 9.378 | 9.397 | 9.416 | 9.435 |
| Woodie | 9.066 | 9.207 | 9.274 | 9.415 | 9.482 | 9.623 | 9.690 |
| Fibonacci | 9.219 | 9.299 | 9.348 | 9.427 | 9.507 | 9.556 | 9.635 |
| Pivot points | S3 | S2 | S1 | PP | R1 | R2 | R3 |
|---|---|---|---|---|---|---|---|
| Standard | 8.754 | 8.928 | 9.162 | 9.336 | 9.570 | 9.744 | 9.978 |
| Camarilla | 9.284 | 9.321 | 9.359 | 9.396 | 9.433 | 9.471 | 9.508 |
| Woodie | 8.784 | 8.943 | 9.192 | 9.351 | 9.600 | 9.759 | 10.008 |
| Fibonacci | 8.928 | 9.084 | 9.180 | 9.336 | 9.492 | 9.588 | 9.744 |
| Pivot points | S3 | S2 | S1 | PP | R1 | R2 | R3 |
|---|---|---|---|---|---|---|---|
| Standard | 7.795 | 8.235 | 8.819 | 9.259 | 9.843 | 10.283 | 10.867 |
| Camarilla | 9.120 | 9.214 | 9.308 | 9.402 | 9.496 | 9.590 | 9.684 |
| Woodie | 7.866 | 8.271 | 8.890 | 9.295 | 9.914 | 10.319 | 10.938 |
| Fibonacci | 8.235 | 8.627 | 8.868 | 9.259 | 9.651 | 9.892 | 10.283 |
Numerical data
The following is the status of technical indicators and moving averages registered at the time this technical analysis was created:
| RSI (14): | 58.31 | |
| MACD (12,26,9): | 0.1160 | |
| Directional Movement: | 4.378 | |
| AROON (14): | -57.143 | |
| DEMA (21): | 9.487 | |
| Parabolic SAR (0,02-0,02-0,2): | 9.111 | |
| Elder Ray (13): | 0.012 | |
| Super Trend (3,10): | 8.848 | |
| Zig ZAG (10): | 9.452 | |
| VORTEX (21): | 1.0070 | |
| Stochastique (14,3,5): | 57.05 | |
| TEMA (21): | 9.463 | |
| Williams %R (14): | -31.52 | |
| Chande Momentum Oscillator (20): | 0.048 | |
| Repulse (5,40,3): | 1.2190 | |
| ROCnROLL: | 1 | |
| TRIX (15,9): | 0.2590 | |
| Courbe Coppock: | 2.01 |
| MA7: | 9.356 | |
| MA20: | 9.410 | |
| MA50: | 8.870 | |
| MA100: | 8.955 | |
| MAexp7: | 9.387 | |
| MAexp20: | 9.308 | |
| MAexp50: | 9.096 | |
| MAexp100: | 9.099 | |
| Price / MA7: | +1.05% | |
| Price / MA20: | +0.47% | |
| Price / MA50: | +6.58% | |
| Price / MA100: | +5.57% | |
| Price / MAexp7: | +0.71% | |
| Price / MAexp20: | +1.57% | |
| Price / MAexp50: | +3.94% | |
| Price / MAexp100: | +3.90% |
News
The last news published on ACERINOX at the time of the generation of this analysis was as follows:
About author
Online


Add a comment
Comments
0 comments on the analysis ACERINOX - Daily