ACERINOX - Daily - Technical analysis published on 11/14/2022 (GMT)
- 245
- 0
Click here for a new analysis!
- Timeframe : Daily
- - Analysis generated on
- Status : LEVEL MAINTAINED

Summary of the analysis

Additional analysis
Quotes
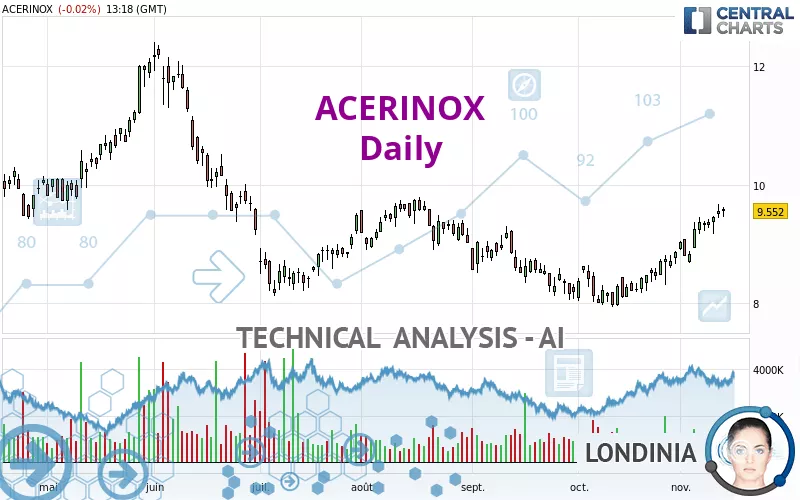
ACERINOX rating 9.552 EUR. The price is lower by -0.02% since the last closing and was traded between 9.462 EUR and 9.630 EUR over the period. The price is currently at +0.95% from its lowest and -0.81% from its highest.Here is a more detailed summary of the historical variations registered by ACERINOX:
Near a new HIGH record (1 month)
Type : Bullish
Timeframe : Weekly
Technical
Technical analysis of ACERINOX in Daily shows a strongly overall bullish trend. 85.71% of the signals given by moving averages are bullish. The overall trend is supported by the strong bullish signals from short-term moving averages. The Central Indicators scanner detects a bullish signal on moving averages that could impact this trend:
Moving Average bullish crossovers : AMA20 & AMA50
Type : Bullish
Timeframe : Daily
In fact, according to the parameters integrated into the Central Analyzer system, 15 technical indicators out of 18 analysed are currently bullish. But beware of excesses. The Central Indicators scanner currently detects this:
RSI indicator is overbought : over 70
Type : Neutral
Timeframe : Daily
CCI indicator is overbought : over 100
Type : Neutral
Timeframe : Daily
RSI indicator: bearish divergence
Type : Bearish
Timeframe : Daily
Williams %R indicator is overbought : over -20
Type : Neutral
Timeframe : Daily
Price is back under the pivot point
Type : Bearish
Timeframe : Daily
The Central Patterns scanner, which studies chart patterns, resistances and supports, has identified this signal:
Near resistance of channel
Type : Bearish
Timeframe : Daily
No result was found by the Central Candlesticks scanner on Japanese candlesticks.
| S3 | S2 | S1 | Price | R1 | R2 | R3 | |
|---|---|---|---|---|---|---|---|
| ProTrendLines | 7.216 | 8.160 | 9.001 | 9.552 | 9.740 | 10.403 | 10.698 |
| Change (%) | -24.46% | -14.57% | -5.77% | - | +1.97% | +8.91% | +12.00% |
| Change | -2.336 | -1.392 | -0.551 | - | +0.188 | +0.851 | +1.146 |
| Level | Intermediate | Major | Major | - | Major | Intermediate | Minor |
Pivot points can also be used to set your price objectives. Here is the price situation in relation to pivot points:
| Pivot points | S3 | S2 | S1 | PP | R1 | R2 | R3 |
|---|---|---|---|---|---|---|---|
| Standard | 9.207 | 9.327 | 9.441 | 9.561 | 9.675 | 9.795 | 9.909 |
| Camarilla | 9.490 | 9.511 | 9.533 | 9.554 | 9.576 | 9.597 | 9.618 |
| Woodie | 9.203 | 9.326 | 9.437 | 9.560 | 9.671 | 9.794 | 9.905 |
| Fibonacci | 9.327 | 9.417 | 9.472 | 9.561 | 9.651 | 9.706 | 9.795 |
| Pivot points | S3 | S2 | S1 | PP | R1 | R2 | R3 |
|---|---|---|---|---|---|---|---|
| Standard | 8.743 | 8.957 | 9.255 | 9.469 | 9.767 | 9.981 | 10.279 |
| Camarilla | 9.413 | 9.460 | 9.507 | 9.554 | 9.601 | 9.648 | 9.695 |
| Woodie | 8.786 | 8.978 | 9.298 | 9.490 | 9.810 | 10.002 | 10.322 |
| Fibonacci | 8.957 | 9.152 | 9.273 | 9.469 | 9.664 | 9.785 | 9.981 |
| Pivot points | S3 | S2 | S1 | PP | R1 | R2 | R3 |
|---|---|---|---|---|---|---|---|
| Standard | 7.293 | 7.615 | 8.239 | 8.561 | 9.185 | 9.507 | 10.131 |
| Camarilla | 8.602 | 8.689 | 8.775 | 8.862 | 8.949 | 9.035 | 9.122 |
| Woodie | 7.443 | 7.691 | 8.389 | 8.637 | 9.335 | 9.583 | 10.281 |
| Fibonacci | 7.615 | 7.977 | 8.200 | 8.561 | 8.923 | 9.146 | 9.507 |
Numerical data
The following are the details of the technical indicators and moving averages that were collected to generate this technical analysis:
| RSI (14): | 70.12 | |
| MACD (12,26,9): | 0.2750 | |
| Directional Movement: | 13.900 | |
| AROON (14): | 78.571 | |
| DEMA (21): | 9.329 | |
| Parabolic SAR (0,02-0,02-0,2): | 9.170 | |
| Elder Ray (13): | 0.369 | |
| Super Trend (3,10): | 8.777 | |
| Zig ZAG (10): | 9.556 | |
| VORTEX (21): | 1.2240 | |
| Stochastique (14,3,5): | 92.89 | |
| TEMA (21): | 9.581 | |
| Williams %R (14): | -9.52 | |
| Chande Momentum Oscillator (20): | 0.796 | |
| Repulse (5,40,3): | 1.5510 | |
| ROCnROLL: | 1 | |
| TRIX (15,9): | 0.3280 | |
| Courbe Coppock: | 21.32 |
| MA7: | 9.409 | |
| MA20: | 8.895 | |
| MA50: | 8.640 | |
| MA100: | 8.830 | |
| MAexp7: | 9.371 | |
| MAexp20: | 9.016 | |
| MAexp50: | 8.835 | |
| MAexp100: | 8.975 | |
| Price / MA7: | +1.52% | |
| Price / MA20: | +7.39% | |
| Price / MA50: | +10.56% | |
| Price / MA100: | +8.18% | |
| Price / MAexp7: | +1.93% | |
| Price / MAexp20: | +5.94% | |
| Price / MAexp50: | +8.12% | |
| Price / MAexp100: | +6.43% |
News
The last news published on ACERINOX at the time of the generation of this analysis was as follows:
About author
Online


Add a comment
Comments
0 comments on the analysis ACERINOX - Daily