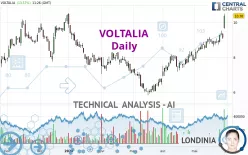
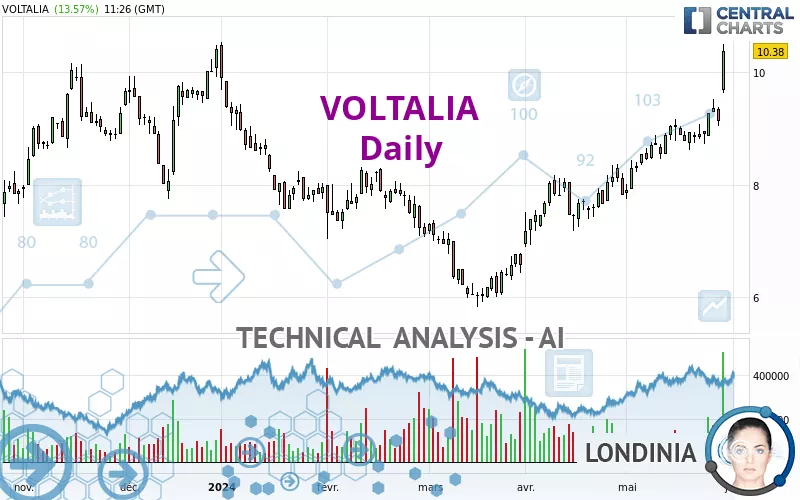
VOLTALIA - Daily - Technical analysis published on 05/30/2024 (GMT)
- 139
- 0
Click here for a new analysis!
- Timeframe : Daily
- - Analysis generated on
- Status : INVALID
Summary of the analysis

Additional analysis
Quotes
VOLTALIA rating 10.38 EUR. The price registered an increase of +13.57% on the session and was between 9.64 EUR and 10.50 EUR. This implies that the price is at +7.68% from its lowest and at -1.14% from its highest.The Central Gaps scanner detects a bullish gap which is a sign that buyers have taken the lead in the very short term.
Opening Gap UP
Type : Bullish
Timeframe : Openning
A study of price movements over other periods shows the following variations:
New HIGH record (1st january)
Type : Bullish
Timeframe : Weekly
Near a new HIGH record (1st january)
Type : Bullish
Timeframe : Weekly
New HIGH record (1 month)
Type : Bullish
Timeframe : Weekly
The Central Volumes scanner notes the presence of abnormal volumes:
Abnormal volumes
Timeframe : 5 days
Technical
Technical analysis of this Daily chart of VOLTALIA indicates that the overall trend is strongly bullish. 89.29% of the signals given by moving averages are bullish. The overall trend is supported by the strong bullish signals from short-term moving averages. The Central Indicators market scanner currently does not detect any result that concerns moving averages.
The probability of a further increase is high given the direction of the technical indicators.
Caution: the Central Indicators scanner currently detects an excess:
RSI indicator is overbought : over 70
Type : Neutral
Timeframe : Daily
CCI indicator is overbought : over 100
Type : Neutral
Timeframe : Daily
Williams %R indicator is overbought : over -20
Type : Neutral
Timeframe : Daily
Pivot points : price is over resistance 3
Type : Neutral
Timeframe : Daily
Pivot points : price is over resistance 3
Type : Neutral
Timeframe : Weekly
An analysis of the price chart with the Central Patterns scanner (detector of chart patterns and resistances and supports) shows a result that can have an impact on the price change:
Near horizontal resistance
Type : Bearish
Timeframe : Daily
No result was found by the Central Candlesticks scanner on Japanese candlesticks.
| S3 | S2 | S1 | Price | R1 | R2 | R3 | |
|---|---|---|---|---|---|---|---|
| ProTrendLines | 7.23 | 8.04 | 9.04 | 10.38 | 10.42 | 14.72 | 16.39 |
| Change (%) | -30.35% | -22.54% | -12.91% | - | +0.39% | +41.81% | +57.90% |
| Change | -3.15 | -2.34 | -1.34 | - | +0.04 | +4.34 | +6.01 |
| Level | Major | Intermediate | Major | - | Intermediate | Minor | Intermediate |
Attention could also be paid to pivot points to set price objectives:
| Pivot points | S3 | S2 | S1 | PP | R1 | R2 | R3 |
|---|---|---|---|---|---|---|---|
| Standard | 8.66 | 8.85 | 9.00 | 9.19 | 9.34 | 9.53 | 9.68 |
| Camarilla | 9.05 | 9.08 | 9.11 | 9.14 | 9.17 | 9.20 | 9.23 |
| Woodie | 8.63 | 8.84 | 8.97 | 9.18 | 9.31 | 9.52 | 9.65 |
| Fibonacci | 8.85 | 8.98 | 9.06 | 9.19 | 9.32 | 9.40 | 9.53 |
| Pivot points | S3 | S2 | S1 | PP | R1 | R2 | R3 |
|---|---|---|---|---|---|---|---|
| Standard | 8.18 | 8.39 | 8.65 | 8.86 | 9.12 | 9.33 | 9.59 |
| Camarilla | 8.77 | 8.81 | 8.86 | 8.90 | 8.94 | 8.99 | 9.03 |
| Woodie | 8.20 | 8.40 | 8.67 | 8.87 | 9.14 | 9.34 | 9.61 |
| Fibonacci | 8.39 | 8.57 | 8.68 | 8.86 | 9.04 | 9.15 | 9.33 |
| Pivot points | S3 | S2 | S1 | PP | R1 | R2 | R3 |
|---|---|---|---|---|---|---|---|
| Standard | 5.55 | 6.22 | 7.02 | 7.69 | 8.49 | 9.16 | 9.96 |
| Camarilla | 7.42 | 7.55 | 7.69 | 7.82 | 7.96 | 8.09 | 8.22 |
| Woodie | 5.62 | 6.25 | 7.09 | 7.72 | 8.56 | 9.19 | 10.03 |
| Fibonacci | 6.22 | 6.78 | 7.13 | 7.69 | 8.25 | 8.60 | 9.16 |
Numerical data
The following is the status of technical indicators and moving averages registered at the time this technical analysis was created:
| RSI (14): | 77.90 | |
| MACD (12,26,9): | 0.4400 | |
| Directional Movement: | 32.15 | |
| AROON (14): | 92.86 | |
| DEMA (21): | 9.48 | |
| Parabolic SAR (0,02-0,02-0,2): | 8.69 | |
| Elder Ray (13): | 0.92 | |
| Super Trend (3,10): | 8.87 | |
| Zig ZAG (10): | 10.42 | |
| VORTEX (21): | 1.1800 | |
| Stochastique (14,3,5): | 81.72 | |
| TEMA (21): | 9.63 | |
| Williams %R (14): | -3.90 | |
| Chande Momentum Oscillator (20): | 1.54 | |
| Repulse (5,40,3): | 9.4000 | |
| ROCnROLL: | 1 | |
| TRIX (15,9): | 0.6700 | |
| Courbe Coppock: | 17.87 |
| MA7: | 9.27 | |
| MA20: | 8.90 | |
| MA50: | 7.98 | |
| MA100: | 7.78 | |
| MAexp7: | 9.41 | |
| MAexp20: | 8.92 | |
| MAexp50: | 8.34 | |
| MAexp100: | 8.39 | |
| Price / MA7: | +11.97% | |
| Price / MA20: | +16.63% | |
| Price / MA50: | +30.08% | |
| Price / MA100: | +33.42% | |
| Price / MAexp7: | +10.31% | |
| Price / MAexp20: | +16.37% | |
| Price / MAexp50: | +24.46% | |
| Price / MAexp100: | +23.72% |
News
The last news published on VOLTALIA at the time of the generation of this analysis was as follows:
- Voltalia wins a 130-megawatt solar project
- Voltalia wins a 266-megawatt maintenance contract in Brazil
- Sud Vannier crowdfunding
- Voltalia SA: Total number of shares and voting rights in the share capital as of February 29, 2024
- Voltalia SA: Turnover growth of +20% in Q4 2023
About author

Online


Add a comment
Comments
0 comments on the analysis VOLTALIA - Daily