FTSE 100
| Open: | - |
| Change: | - |
| Volume: | - |
| Low: | - |
| High: | - |
| High / Low range: | - |
| Type: | Indices |
| Ticker: | FTSE |
| ISIN: | GB0001383545 |
FTSE 100 - Bullish Momentum; Next Target 7130 - 12/29/2016 (GMT)
- 1.2k
- 0
- 12/29/2016 - 10:28
- Who voted?
- Timeframe : Daily

FTSE 100 Chart
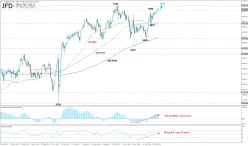
The FTSE100 index edged sharply higher over this month, adding 5% gains in December following the strong support that found on the 100-weekly SMA which overlaps with the 6510 barrier. The price continues the aggressive rally to the upside, despite the ongoing concerns about Brexit
On the weekly timeframe, the three SMAs are pointing upwards while the 50 is approaching the other two. In the next sessions, a bullish crossover will be created (50-SMA to cross above the 100-SMA) while the price is developing well above them. Going to the daily chart, the price had a rebound on the 6650 barrier which is near the 50 and 100 SMAs. The index penetrated successfully the 7065 level and the next level to watch is the 7130 resistance level. Technical indicators are confirming the recent bullish attitude as both are following a positive path. The Relative Strength Index (RSI) is rising and is approaching the 70 level whilst the MACD oscillator lies above its trigger and zero lines.
On the weekly timeframe, the three SMAs are pointing upwards while the 50 is approaching the other two. In the next sessions, a bullish crossover will be created (50-SMA to cross above the 100-SMA) while the price is developing well above them. Going to the daily chart, the price had a rebound on the 6650 barrier which is near the 50 and 100 SMAs. The index penetrated successfully the 7065 level and the next level to watch is the 7130 resistance level. Technical indicators are confirming the recent bullish attitude as both are following a positive path. The Relative Strength Index (RSI) is rising and is approaching the 70 level whilst the MACD oscillator lies above its trigger and zero lines.
This member did not declare if he had a position on this financial instrument or a related financial instrument.
About author

Offline


Add a comment
Comments
0 comments on the analysis FTSE 100 - Daily