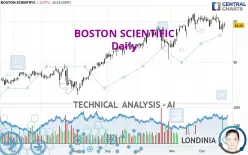
BOSTON SCIENTIFIC - Daily - Technical analysis published on 12/23/2024 (GMT)
- 108
- 0
Click here for a new analysis!
- Timeframe : Daily
- - Analysis generated on
- Status : TARGET REACHED

Summary of the analysis

Additional analysis
Quotes
The BOSTON SCIENTIFIC price is 88.89 USD. The price registered a decrease of -0.07% on the session and was traded between 88.36 USD and 89.75 USD over the period. The price is currently at +0.60% from its lowest and -0.96% from its highest.The Central Gaps scanner detects a bullish opening. A small advantage for buyers in the very short term.
Bullish opening
Type : Bullish
Timeframe : Openning
A study of price movements over other periods shows the following variations:
Near a new HIGH record (5 years)
Type : Bullish
Timeframe : Weekly
Near a new HIGH record (1 year)
Type : Bullish
Timeframe : Weekly
Near a new HIGH record (1st january)
Type : Bullish
Timeframe : Weekly
Near a new HIGH record (1 month)
Type : Bullish
Timeframe : Weekly
New LOW record (1 month)
Type : Bearish
Timeframe : Weekly
Technical
Technical analysis of this Daily chart of BOSTON SCIENTIFIC indicates that the overall trend is bullish. The signals given by moving averages are 71.43% bullish. This bullish trend could slow down given the neutral signals currently being given by short-term moving averages. The Central Indicators scanner does not detect any result on moving averages that would impact this trend.
In fact, according to the parameters integrated into the Central Analyzer system, only 7 technical indicators out of 18 analysed are currently bearish. But beware of excesses. The Central Indicators scanner currently detects this:
CCI indicator is oversold : under -100
Type : Neutral
Timeframe : Daily
Price is back under the pivot point
Type : Bearish
Timeframe : Daily
Price is back under the pivot point
Type : Bearish
Timeframe : Weekly
Central Patterns, the market scanner focusing on chart patterns, resistances and supports found this result:
Horizontal support is broken
Type : Bearish
Timeframe : Daily
No result was found by the Central Candlesticks scanner on Japanese candlesticks.
| S3 | S2 | S1 | Price | R1 | |
|---|---|---|---|---|---|
| ProTrendLines | 72.96 | 83.64 | 88.72 | 88.89 | 90.63 |
| Change (%) | -17.92% | -5.91% | -0.19% | - | +1.96% |
| Change | -15.93 | -5.25 | -0.17 | - | +1.74 |
| Level | Major | Intermediate | Intermediate | - | Intermediate |
Attention could also be paid to pivot points to set price objectives:
| Pivot points | S3 | S2 | S1 | PP | R1 | R2 | R3 |
|---|---|---|---|---|---|---|---|
| Standard | 85.16 | 86.20 | 87.58 | 88.62 | 90.00 | 91.04 | 92.42 |
| Camarilla | 88.29 | 88.51 | 88.73 | 88.95 | 89.17 | 89.39 | 89.62 |
| Woodie | 85.32 | 86.29 | 87.74 | 88.71 | 90.16 | 91.13 | 92.58 |
| Fibonacci | 86.20 | 87.13 | 87.70 | 88.62 | 89.55 | 90.12 | 91.04 |
| Pivot points | S3 | S2 | S1 | PP | R1 | R2 | R3 |
|---|---|---|---|---|---|---|---|
| Standard | 82.60 | 84.92 | 86.94 | 89.26 | 91.28 | 93.60 | 95.62 |
| Camarilla | 87.76 | 88.15 | 88.55 | 88.95 | 89.35 | 89.75 | 90.14 |
| Woodie | 82.44 | 84.85 | 86.78 | 89.19 | 91.12 | 93.53 | 95.46 |
| Fibonacci | 84.92 | 86.58 | 87.61 | 89.26 | 90.92 | 91.95 | 93.60 |
| Pivot points | S3 | S2 | S1 | PP | R1 | R2 | R3 |
|---|---|---|---|---|---|---|---|
| Standard | 77.05 | 80.28 | 85.48 | 88.71 | 93.91 | 97.14 | 102.34 |
| Camarilla | 88.37 | 89.15 | 89.92 | 90.69 | 91.46 | 92.24 | 93.01 |
| Woodie | 78.05 | 80.77 | 86.48 | 89.20 | 94.91 | 97.63 | 103.34 |
| Fibonacci | 80.28 | 83.50 | 85.49 | 88.71 | 91.93 | 93.92 | 97.14 |
Numerical data
The following are the details of the technical indicators and moving averages that were collected to generate this technical analysis:
| RSI (14): | 46.30 | |
| MACD (12,26,9): | 0.1600 | |
| Directional Movement: | -7.84 | |
| AROON (14): | -28.57 | |
| DEMA (21): | 89.86 | |
| Parabolic SAR (0,02-0,02-0,2): | 90.90 | |
| Elder Ray (13): | -0.40 | |
| Super Trend (3,10): | 86.49 | |
| Zig ZAG (10): | 88.64 | |
| VORTEX (21): | 0.9400 | |
| Stochastique (14,3,5): | 31.83 | |
| TEMA (21): | 89.17 | |
| Williams %R (14): | -68.66 | |
| Chande Momentum Oscillator (20): | -1.88 | |
| Repulse (5,40,3): | -1.0900 | |
| ROCnROLL: | -1 | |
| TRIX (15,9): | 0.0900 | |
| Courbe Coppock: | 2.51 |
| MA7: | 89.33 | |
| MA20: | 89.92 | |
| MA50: | 88.27 | |
| MA100: | 84.67 | |
| MAexp7: | 89.17 | |
| MAexp20: | 89.43 | |
| MAexp50: | 88.04 | |
| MAexp100: | 84.96 | |
| Price / MA7: | -0.49% | |
| Price / MA20: | -1.15% | |
| Price / MA50: | +0.70% | |
| Price / MA100: | +4.98% | |
| Price / MAexp7: | -0.31% | |
| Price / MAexp20: | -0.60% | |
| Price / MAexp50: | +0.97% | |
| Price / MAexp100: | +4.63% |
News
Don't forget to follow the news on BOSTON SCIENTIFIC. At the time of publication of this analysis, the latest news was as follows:
- Boston Scientific: Meeting Disabilities With Inclusion
- Boston Scientific: Honoring Our Indigenous Community - Past, Present and Future
- Boston Scientific: Sparking Social Change Through Volunteering
- Boston Scientific: When a Loved One Has Parkinson’s Disease
- Meet Three Boston Scientific Employees Committed to Protecting People From Stroke
About author
Online


Add a comment
Comments
0 comments on the analysis BOSTON SCIENTIFIC - Daily