USD/RUB - Daily - Technical analysis published on 09/25/2022 (GMT)
- 150
- 0
Click here for a new analysis!
- Timeframe : Daily
- - Analysis generated on
- Status : INVALID

Summary of the analysis
Additional analysis
Quotes
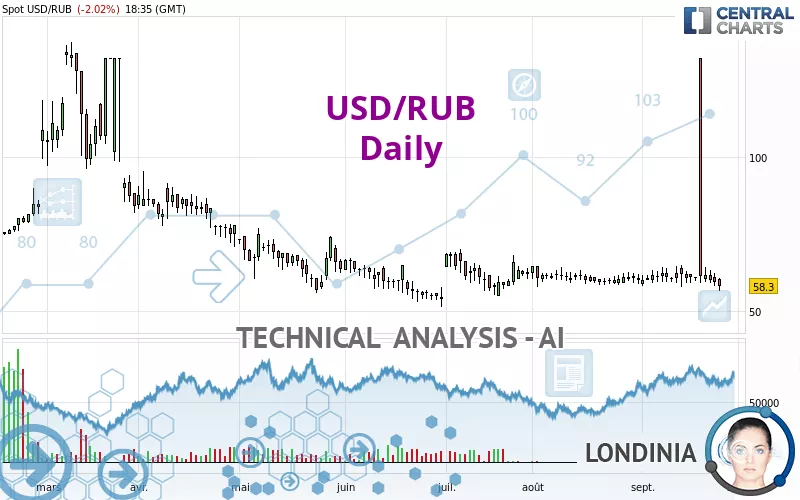
USD/RUB rating 58.3000 RUB. On the day, this instrument lost -2.02% and was traded between 56.5000 RUB and 60.8750 RUB over the period. The price is currently at +3.19% from its lowest and -4.23% from its highest.The Central Gaps scanner detects a bullish opening. A small advantage for buyers in the very short term.
Bullish opening
Type : Bullish
Timeframe : Openning
A study of price movements over other periods shows the following variations:
Near a new HIGH record (5 years)
Type : Bullish
Timeframe : Weekly
New LOW record (1 month)
Type : Bearish
Timeframe : Weekly
Technical
Technical analysis of this Daily chart of USD/RUB indicates that the overall trend is strongly bearish. 92.86% of the signals given by moving averages are bearish. The overall trend is supported by the strong bearish signals from short-term moving averages. An assessment of moving averages reveals a bearish signal that could impact this trend:
Moving Average bearish crossovers : MA20 & MA50
Type : Bearish
Timeframe : Daily
An assessment of technical indicators does not currently provide any relevant information on the direction of future price movements.
Caution: the Central Indicators scanner currently detects an excess:
CCI indicator is oversold : under -100
Type : Neutral
Timeframe : Daily
Williams %R indicator is oversold : under -80
Type : Neutral
Timeframe : Daily
Price is back under the pivot point
Type : Bearish
Timeframe : Daily
Price is back under the pivot point
Type : Bearish
Timeframe : Weekly
An analysis of the price chart with the Central Patterns scanner (detector of chart patterns and resistances and supports) shows a result that can have an impact on the price change:
Near support of triangle
Type : Bullish
Timeframe : Daily
Central Candlesticks, the scanner specialised in Japanese candlesticks, detects a bearish signal that could support the hypothesis of a small drop in the very short term:
Three black crows
Type : Bearish
Timeframe : Daily
| S2 | S1 | Price | R1 | R2 | R3 | |
|---|---|---|---|---|---|---|
| ProTrendLines | 33.5957 | 55.7310 | 58.3000 | 62.8536 | 69.8633 | 81.6570 |
| Change (%) | -42.37% | -4.41% | - | +7.81% | +19.83% | +40.06% |
| Change | -24.7043 | -2.5690 | - | +4.5536 | +11.5633 | +23.3570 |
| Level | Minor | Major | - | Intermediate | Major | Major |
To determine price objectives, it is also possible to use the pivot points. Here is the price position in relation to pivot points:
| Pivot points | S3 | S2 | S1 | PP | R1 | R2 | R3 |
|---|---|---|---|---|---|---|---|
| Standard | 53.2417 | 55.6333 | 57.5667 | 59.9583 | 61.8917 | 64.2833 | 66.2167 |
| Camarilla | 58.3106 | 58.7071 | 59.1035 | 59.5000 | 59.8965 | 60.2929 | 60.6894 |
| Woodie | 53.0125 | 55.5188 | 57.3375 | 59.8438 | 61.6625 | 64.1688 | 65.9875 |
| Fibonacci | 55.6333 | 57.2855 | 58.3062 | 59.9583 | 61.6105 | 62.6312 | 64.2833 |
| Pivot points | S3 | S2 | S1 | PP | R1 | R2 | R3 |
|---|---|---|---|---|---|---|---|
| Standard | 50.2065 | 54.0357 | 57.3766 | 61.2058 | 64.5467 | 68.3759 | 71.7168 |
| Camarilla | 58.7457 | 59.4030 | 60.0602 | 60.7175 | 61.3748 | 62.0320 | 62.6893 |
| Woodie | 49.9624 | 53.9136 | 57.1325 | 61.0837 | 64.3026 | 68.2538 | 71.4727 |
| Fibonacci | 54.0357 | 56.7747 | 58.4668 | 61.2058 | 63.9448 | 65.6369 | 68.3759 |
| Pivot points | S3 | S2 | S1 | PP | R1 | R2 | R3 |
|---|---|---|---|---|---|---|---|
| Standard | 49.8958 | 53.7917 | 56.9583 | 60.8542 | 64.0208 | 67.9167 | 71.0833 |
| Camarilla | 58.1828 | 58.8302 | 59.4776 | 60.1250 | 60.7724 | 61.4198 | 62.0672 |
| Woodie | 49.5313 | 53.6094 | 56.5938 | 60.6719 | 63.6563 | 67.7344 | 70.7188 |
| Fibonacci | 53.7917 | 56.4895 | 58.1563 | 60.8542 | 63.5520 | 65.2188 | 67.9167 |
Numerical data
The following is the status of the technical indicators and moving averages at the time of publication of this technical analysis:
| RSI (14): | 38.61 | |
| MACD (12,26,9): | -0.2952 | |
| Directional Movement: | 49.9039 | |
| AROON (14): | -28.5714 | |
| DEMA (21): | 60.3194 | |
| Parabolic SAR (0,02-0,02-0,2): | 127.7336 | |
| Elder Ray (13): | -1.7630 | |
| Super Trend (3,10): | 83.9262 | |
| Zig ZAG (10): | 58.3000 | |
| VORTEX (21): | 0.9869 | |
| Stochastique (14,3,5): | 2.58 | |
| TEMA (21): | 60.1735 | |
| Williams %R (14): | -97.62 | |
| Chande Momentum Oscillator (20): | -4.1850 | |
| Repulse (5,40,3): | -36.7744 | |
| ROCnROLL: | 2 | |
| TRIX (15,9): | -0.0074 | |
| Courbe Coppock: | 2.12 |
| MA7: | 60.4541 | |
| MA20: | 60.8084 | |
| MA50: | 60.8472 | |
| MA100: | 62.1847 | |
| MAexp7: | 60.0570 | |
| MAexp20: | 60.6163 | |
| MAexp50: | 61.4356 | |
| MAexp100: | 64.6067 | |
| Price / MA7: | -3.56% | |
| Price / MA20: | -4.13% | |
| Price / MA50: | -4.19% | |
| Price / MA100: | -6.25% | |
| Price / MAexp7: | -2.93% | |
| Price / MAexp20: | -3.82% | |
| Price / MAexp50: | -5.10% | |
| Price / MAexp100: | -9.76% |
News
The last news published on USD/RUB at the time of the generation of this analysis was as follows:
-
 USD/RUB Forecast May 6, 2020
-
USD/RUB Forecast April 24, 2020
-
USD/RUB Forecast April 17, 2020
-
Crude Oil & Trump USD/RUB
-
USD/RUB Hit By Low Oil Price
About author

Online


Add a comment
Comments
0 comments on the analysis USD/RUB - Daily