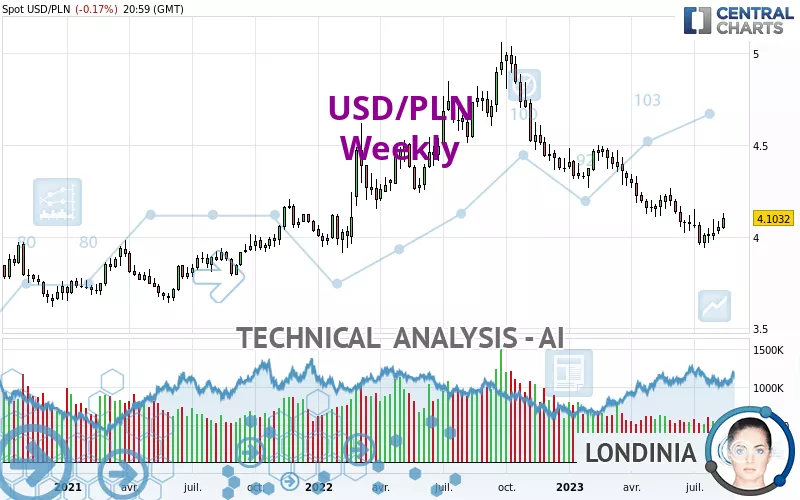
USD/PLN - Weekly - Technical analysis published on 08/19/2023 (GMT)
- 259
- 0
Click here for a new analysis!
- Timeframe : Weekly
- - Analysis generated on
- Status : INVALID

Summary of the analysis

Additional analysis
Quotes
USD/PLN rating 4.1032 PLN. Over 5 days, this instrument gained +1.31% and was traded between 4.0720 PLN and 4.1303 PLN over the period. The price is currently at +0.77% from its lowest point and -0.66% from its highest point.The Central Gaps scanner detects a bearish opening marking the presence of sellers ahead of buyers at the opening but not sufficiently marked to allow the price to register a quotation gap.
Bearish opening
Type : Bearish
Timeframe : Openning
A study of price movements over other periods shows the following variations:
Near a new LOW record (1 year)
Type : Bearish
Timeframe : Weekly
Near a new LOW record (1st january)
Type : Bearish
Timeframe : Weekly
New HIGH record (1 month)
Type : Bullish
Timeframe : Weekly
Technical
A technical analysis in Weekly of this USD/PLN chart shows a bearish trend. 75.00% of the signals given by moving averages are bearish. This bearish trend is supported by the strong bearish signals given by short-term moving averages. An assessment of moving averages reveals a bullish signal that could impact this trend:
Bullish price crossover with adaptative moving average 20
Type : Bullish
Timeframe : Weekly
In fact, Central Analyzer took into account 18 technical indicators and the result was as follows: 8 are bullish, 6 are neutral and 4 are bearish. Central Indicators, the detector scanner for these technical indicators has recently detected several signals:
Pivot points : price is over resistance 1
Type : Neutral
Timeframe : Weekly
Williams %R indicator is back over -50
Type : Bullish
Timeframe : Weekly
No signals are given by Central Patterns, a market scanner specialised in chart patterns, resistances and supports.
The Central Candlesticks scanner, specialised in Japanese candlesticks, did not identify any signals.
| S3 | S2 | S1 | Price | R1 | R2 | R3 | |
|---|---|---|---|---|---|---|---|
| ProTrendLines | 3.6569 | 3.7754 | 3.9017 | 4.1032 | 4.1143 | 4.2695 | 4.4785 |
| Change (%) | -10.88% | -7.99% | -4.91% | - | +0.27% | +4.05% | +9.15% |
| Change | -0.4463 | -0.3278 | -0.2015 | - | +0.0111 | +0.1663 | +0.3753 |
| Level | Minor | Minor | Major | - | Major | Major | Major |
Attention could also be paid to pivot points to set price objectives:
| Pivot points | S3 | S2 | S1 | PP | R1 | R2 | R3 |
|---|---|---|---|---|---|---|---|
| Standard | 4.0527 | 4.0737 | 4.0884 | 4.1094 | 4.1241 | 4.1451 | 4.1598 |
| Camarilla | 4.0934 | 4.0967 | 4.0999 | 4.1032 | 4.1065 | 4.1098 | 4.1130 |
| Woodie | 4.0497 | 4.0721 | 4.0854 | 4.1078 | 4.1211 | 4.1435 | 4.1568 |
| Fibonacci | 4.0737 | 4.0873 | 4.0957 | 4.1094 | 4.1230 | 4.1314 | 4.1451 |
| Pivot points | S3 | S2 | S1 | PP | R1 | R2 | R3 |
|---|---|---|---|---|---|---|---|
| Standard | 3.9492 | 3.9827 | 4.0165 | 4.0500 | 4.0838 | 4.1173 | 4.1511 |
| Camarilla | 4.0317 | 4.0379 | 4.0440 | 4.0502 | 4.0564 | 4.0625 | 4.0687 |
| Woodie | 3.9493 | 3.9828 | 4.0166 | 4.0501 | 4.0839 | 4.1174 | 4.1512 |
| Fibonacci | 3.9827 | 4.0084 | 4.0243 | 4.0500 | 4.0757 | 4.0916 | 4.1173 |
| Pivot points | S3 | S2 | S1 | PP | R1 | R2 | R3 |
|---|---|---|---|---|---|---|---|
| Standard | 3.6919 | 3.8138 | 3.9097 | 4.0316 | 4.1275 | 4.2494 | 4.3453 |
| Camarilla | 3.9458 | 3.9658 | 3.9857 | 4.0057 | 4.0257 | 4.0456 | 4.0656 |
| Woodie | 3.6790 | 3.8073 | 3.8968 | 4.0251 | 4.1146 | 4.2429 | 4.3324 |
| Fibonacci | 3.8138 | 3.8970 | 3.9484 | 4.0316 | 4.1148 | 4.1662 | 4.2494 |
Numerical data
The following is the status of the technical indicators and moving averages at the time of publication of this technical analysis:
| RSI (14): | 42.40 | |
| MACD (12,26,9): | -0.0888 | |
| Directional Movement: | -4.3020 | |
| AROON (14): | -50.0000 | |
| DEMA (21): | 4.0080 | |
| Parabolic SAR (0,02-0,02-0,2): | 3.9420 | |
| Elder Ray (13): | 0.0016 | |
| Super Trend (3,10): | 4.2661 | |
| Zig ZAG (10): | 4.1032 | |
| VORTEX (21): | 0.8726 | |
| Stochastique (14,3,5): | 37.24 | |
| TEMA (21): | 3.9887 | |
| Williams %R (14): | -49.03 | |
| Chande Momentum Oscillator (20): | -0.1208 | |
| Repulse (5,40,3): | 1.1795 | |
| ROCnROLL: | -1 | |
| TRIX (15,9): | -0.3387 | |
| Courbe Coppock: | 7.84 |
| MA7: | 4.0868 | |
| MA20: | 4.0518 | |
| MA50: | 4.0514 | |
| MA100: | 4.1240 | |
| MAexp7: | 4.0568 | |
| MAexp20: | 4.1306 | |
| MAexp50: | 4.2531 | |
| MAexp100: | 4.2453 | |
| Price / MA7: | +0.40% | |
| Price / MA20: | +1.27% | |
| Price / MA50: | +1.28% | |
| Price / MA100: | -0.50% | |
| Price / MAexp7: | +1.14% | |
| Price / MAexp20: | -0.66% | |
| Price / MAexp50: | -3.52% | |
| Price / MAexp100: | -3.35% |
About author

Online


Add a comment
Comments
0 comments on the analysis USD/PLN - Weekly