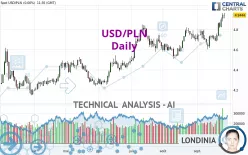
USD/PLN - Daily - Technical analysis published on 09/27/2022 (GMT)
- 167
- 0
Click here for a new analysis!
- Timeframe : Daily
- - Analysis generated on
- Status : TARGET REACHED

Summary of the analysis

Additional analysis
Quotes
USD/PLN rating 4.9443 PLN. On the day, this instrument gained +0.00% with the lowest point at 4.9129 PLN and the highest point at 4.9636 PLN. The deviation from the price is +0.64% for the low point and -0.39% for the high point.The Central Gaps scanner detects a bullish opening. A small advantage for buyers in the very short term.
Bullish opening
Type : Bullish
Timeframe : Openning
A study of price movements over other periods shows the following variations:
New HIGH record (5 years)
Type : Bullish
Timeframe : Weekly
Near a new HIGH record (1 year)
Type : Bullish
Timeframe : Weekly
Near a new HIGH record (1st january)
Type : Bullish
Timeframe : Weekly
Near a new HIGH record (1 month)
Type : Bullish
Timeframe : Weekly
Technical
Technical analysis of USD/PLN in Daily shows a strongly overall bullish trend. The signals given by the moving averages are 92.86% bullish. This strong bullish trend is confirmed by the strong signals currently being given by short-term moving averages. There is no crossing of moving average by the price or crossing of moving averages between themselves.
The probability of a further increase is high given the direction of the technical indicators.
Caution: the Central Indicators scanner currently detects an excess:
RSI indicator is overbought : over 70
Type : Neutral
Timeframe : Daily
CCI indicator is overbought : over 100
Type : Neutral
Timeframe : Daily
Previous candle closed over Bollinger bands
Type : Neutral
Timeframe : Daily
Williams %R indicator is overbought : over -20
Type : Neutral
Timeframe : Daily
Central Patterns, the market scanner focusing on chart patterns, resistances and supports found these results:
Near resistance of channel
Type : Bearish
Timeframe : Daily
Near horizontal support
Type : Bullish
Timeframe : Daily
The Central Candlesticks scanner which studies Japanese candlesticks did not detect anything.
| S3 | S2 | S1 | Price | |
|---|---|---|---|---|
| ProTrendLines | 4.2915 | 4.5406 | 4.8175 | 4.9443 |
| Change (%) | -13.20% | -8.16% | -2.56% | - |
| Change | -0.6528 | -0.4037 | -0.1268 | - |
| Level | Major | Intermediate | Major | - |
Attention could also be paid to pivot points to set price objectives:
| Pivot points | S3 | S2 | S1 | PP | R1 | R2 | R3 |
|---|---|---|---|---|---|---|---|
| Standard | 4.8125 | 4.8469 | 4.8956 | 4.9300 | 4.9787 | 5.0131 | 5.0618 |
| Camarilla | 4.9216 | 4.9292 | 4.9368 | 4.9444 | 4.9520 | 4.9596 | 4.9673 |
| Woodie | 4.8198 | 4.8505 | 4.9029 | 4.9336 | 4.9860 | 5.0167 | 5.0691 |
| Fibonacci | 4.8469 | 4.8786 | 4.8982 | 4.9300 | 4.9617 | 4.9813 | 5.0131 |
| Pivot points | S3 | S2 | S1 | PP | R1 | R2 | R3 |
|---|---|---|---|---|---|---|---|
| Standard | 4.5043 | 4.5928 | 4.7454 | 4.8339 | 4.9865 | 5.0750 | 5.2276 |
| Camarilla | 4.8318 | 4.8539 | 4.8760 | 4.8981 | 4.9202 | 4.9423 | 4.9644 |
| Woodie | 4.5365 | 4.6088 | 4.7776 | 4.8499 | 5.0187 | 5.0910 | 5.2598 |
| Fibonacci | 4.5928 | 4.6849 | 4.7418 | 4.8339 | 4.9260 | 4.9829 | 5.0750 |
| Pivot points | S3 | S2 | S1 | PP | R1 | R2 | R3 |
|---|---|---|---|---|---|---|---|
| Standard | 4.2198 | 4.3641 | 4.5352 | 4.6795 | 4.8506 | 4.9949 | 5.1660 |
| Camarilla | 4.6197 | 4.6486 | 4.6775 | 4.7064 | 4.7353 | 4.7642 | 4.7931 |
| Woodie | 4.2333 | 4.3708 | 4.5487 | 4.6862 | 4.8641 | 5.0016 | 5.1795 |
| Fibonacci | 4.3641 | 4.4846 | 4.5590 | 4.6795 | 4.8000 | 4.8744 | 4.9949 |
Numerical data
The following are the details of the technical indicators and moving averages that were collected to generate this technical analysis:
| RSI (14): | 69.59 | |
| MACD (12,26,9): | 0.0566 | |
| Directional Movement: | 18.3765 | |
| AROON (14): | 71.4285 | |
| DEMA (21): | 4.8512 | |
| Parabolic SAR (0,02-0,02-0,2): | 4.6874 | |
| Elder Ray (13): | 0.1207 | |
| Super Trend (3,10): | 4.7267 | |
| Zig ZAG (10): | 4.9479 | |
| VORTEX (21): | 1.1333 | |
| Stochastique (14,3,5): | 94.13 | |
| TEMA (21): | 4.8814 | |
| Williams %R (14): | -4.58 | |
| Chande Momentum Oscillator (20): | 0.2742 | |
| Repulse (5,40,3): | 2.2065 | |
| ROCnROLL: | 1 | |
| TRIX (15,9): | 0.0959 | |
| Courbe Coppock: | 5.60 |
| MA7: | 4.8454 | |
| MA20: | 4.7631 | |
| MA50: | 4.7010 | |
| MA100: | 4.5835 | |
| MAexp7: | 4.8662 | |
| MAexp20: | 4.7863 | |
| MAexp50: | 4.7081 | |
| MAexp100: | 4.6030 | |
| Price / MA7: | +2.04% | |
| Price / MA20: | +3.80% | |
| Price / MA50: | +5.18% | |
| Price / MA100: | +7.87% | |
| Price / MAexp7: | +1.61% | |
| Price / MAexp20: | +3.30% | |
| Price / MAexp50: | +5.02% | |
| Price / MAexp100: | +7.42% |
About author
Online


Add a comment
Comments
0 comments on the analysis USD/PLN - Daily