USD/PLN - Daily - Technical analysis published on 09/13/2022 (GMT)
- 151
- 0
- Timeframe : Daily
- - Analysis generated on
- Status : NEUTRAL
Summary of the analysis

Additional analysis
Quotes
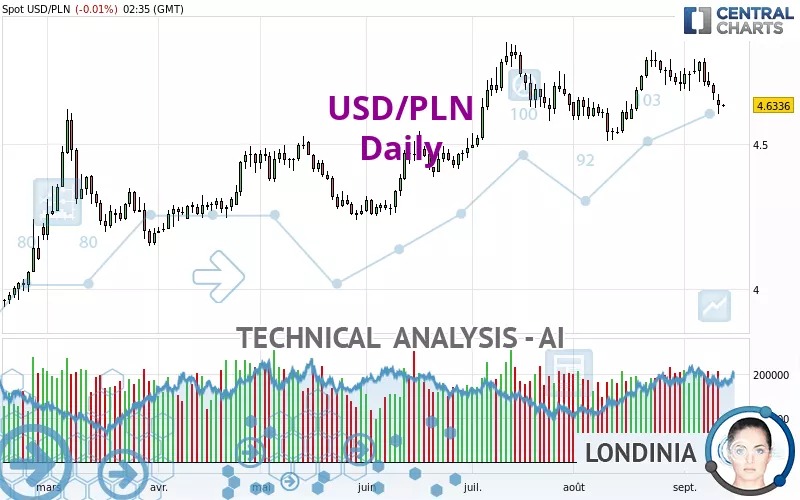
The USD/PLN rating is 4.6336 PLN. On the day, this instrument lost -0.01% with the lowest point at 4.6257 PLN and the highest point at 4.6363 PLN. The deviation from the price is +0.17% for the low point and -0.06% for the high point.The Central Gaps scanner detects a bullish opening. A small advantage for buyers in the very short term.
Bullish opening
Type : Bullish
Timeframe : Openning
A study of price movements over other periods shows the following variations:
Near a new HIGH record (5 years)
Type : Bullish
Timeframe : Weekly
Near a new HIGH record (1 year)
Type : Bullish
Timeframe : Weekly
Near a new HIGH record (1st january)
Type : Bullish
Timeframe : Weekly
Near a new HIGH record (1 month)
Type : Bullish
Timeframe : Weekly
Technical
Technical analysis of this Daily chart of USD/PLN indicates that the overall trend is slightly bullish. Only 60.71% of the signals given by moving averages are bullish. This slightly bullish trend could turn neutral or reverse given the slightly bearish signals currently being given by short-term moving averages. The Central Indicators market scanner is currently detecting a bearish signal that could impact this trend:
Bearish trend reversal : adaptative moving average 50
Type : Bearish
Timeframe : Daily
In fact, 12 technical indicators on 18 studied are currently bearish. Caution: the Central Indicators scanner currently detects an excess:
CCI indicator is oversold : under -100
Type : Neutral
Timeframe : Daily
Williams %R indicator is oversold : under -80
Type : Neutral
Timeframe : Daily
The Central Patterns scanner, which studies chart patterns, resistances and supports, has identified these signals:
Near support of channel
Type : Bullish
Timeframe : Daily
Near support of triangle
Type : Bullish
Timeframe : Daily
The presence of these Japanese chandelier patterns detected by Central Candlesticks that could impact the current short-term trend were also noted:
Bullish harami cross
Type : Bullish
Timeframe : Daily
Doji
Type : Neutral
Timeframe : Daily
| S3 | S2 | S1 | Price | R1 | R2 | |
|---|---|---|---|---|---|---|
| ProTrendLines | 4.2915 | 4.4035 | 4.5406 | 4.6336 | 4.7023 | 4.8175 |
| Change (%) | -7.38% | -4.97% | -2.01% | - | +1.48% | +3.97% |
| Change | -0.3421 | -0.2301 | -0.0930 | - | +0.0687 | +0.1839 |
| Level | Major | Minor | Intermediate | - | Intermediate | Major |
To determine price objectives, it is also possible to use the pivot points. Here is the price position in relation to pivot points:
| Pivot points | S3 | S2 | S1 | PP | R1 | R2 | R3 |
|---|---|---|---|---|---|---|---|
| Standard | 4.5363 | 4.5703 | 4.6022 | 4.6362 | 4.6681 | 4.7021 | 4.7340 |
| Camarilla | 4.6159 | 4.6219 | 4.6280 | 4.6340 | 4.6400 | 4.6461 | 4.6521 |
| Woodie | 4.5352 | 4.5698 | 4.6011 | 4.6357 | 4.6670 | 4.7016 | 4.7329 |
| Fibonacci | 4.5703 | 4.5955 | 4.6111 | 4.6362 | 4.6614 | 4.6770 | 4.7021 |
| Pivot points | S3 | S2 | S1 | PP | R1 | R2 | R3 |
|---|---|---|---|---|---|---|---|
| Standard | 4.4736 | 4.5626 | 4.6183 | 4.7073 | 4.7630 | 4.8520 | 4.9077 |
| Camarilla | 4.6341 | 4.6474 | 4.6606 | 4.6739 | 4.6872 | 4.7004 | 4.7137 |
| Woodie | 4.4569 | 4.5543 | 4.6016 | 4.6990 | 4.7463 | 4.8437 | 4.8910 |
| Fibonacci | 4.5626 | 4.6179 | 4.6521 | 4.7073 | 4.7626 | 4.7968 | 4.8520 |
| Pivot points | S3 | S2 | S1 | PP | R1 | R2 | R3 |
|---|---|---|---|---|---|---|---|
| Standard | 4.2198 | 4.3641 | 4.5352 | 4.6795 | 4.8506 | 4.9949 | 5.1660 |
| Camarilla | 4.6197 | 4.6486 | 4.6775 | 4.7064 | 4.7353 | 4.7642 | 4.7931 |
| Woodie | 4.2333 | 4.3708 | 4.5487 | 4.6862 | 4.8641 | 5.0016 | 5.1795 |
| Fibonacci | 4.3641 | 4.4846 | 4.5590 | 4.6795 | 4.8000 | 4.8744 | 4.9949 |
Numerical data
The following is the status of technical indicators and moving averages registered at the time this technical analysis was created:
| RSI (14): | 41.71 | |
| MACD (12,26,9): | 0.0051 | |
| Directional Movement: | -6.5745 | |
| AROON (14): | -92.8571 | |
| DEMA (21): | 4.7098 | |
| Parabolic SAR (0,02-0,02-0,2): | 4.7918 | |
| Elder Ray (13): | -0.0644 | |
| Super Trend (3,10): | 4.6019 | |
| Zig ZAG (10): | 4.6332 | |
| VORTEX (21): | 1.0645 | |
| Stochastique (14,3,5): | 14.06 | |
| TEMA (21): | 4.6892 | |
| Williams %R (14): | -84.74 | |
| Chande Momentum Oscillator (20): | -0.1205 | |
| Repulse (5,40,3): | -0.7906 | |
| ROCnROLL: | -1 | |
| TRIX (15,9): | 0.0676 | |
| Courbe Coppock: | 1.71 |
| MA7: | 4.6991 | |
| MA20: | 4.7217 | |
| MA50: | 4.6849 | |
| MA100: | 4.5464 | |
| MAexp7: | 4.6803 | |
| MAexp20: | 4.6948 | |
| MAexp50: | 4.6498 | |
| MAexp100: | 4.5538 | |
| Price / MA7: | -1.39% | |
| Price / MA20: | -1.87% | |
| Price / MA50: | -1.10% | |
| Price / MA100: | +1.92% | |
| Price / MAexp7: | -1.00% | |
| Price / MAexp20: | -1.30% | |
| Price / MAexp50: | -0.35% | |
| Price / MAexp100: | +1.75% |
About author
Online


Add a comment
Comments
0 comments on the analysis USD/PLN - Daily