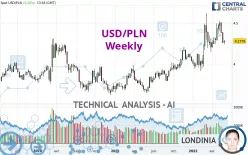
USD/PLN - Weekly - Technical analysis published on 06/01/2022 (GMT)
- 246
- 0
I am delighted to see that my first price objective has been achieved. I hope you've taken advantage of it.
Click here for a new analysis!
Click here for a new analysis!
- Timeframe : Weekly
- - Analysis generated on
- Status : TARGET REACHED

Summary of the analysis
Trends
Short term:
Strongly bullish
Underlying:
Strongly bullish
Technical indicators
11%
39%
50%
My opinion
Bullish above 4.1881 PLN
My targets
4.4518 PLN (+0.1738)
4.5826 PLN (+0.3046)
My analysis
USD/PLN is part of a very strong bullish trend. Traders may consider trading only long positions (at the time of purchase) as long as the price remains well above 4.1881 PLN. The next resistance located at 4.4518 PLN is the next bullish objective to be reached. A bullish break in this resistance would boost the bullish momentum. The bullish movement could then continue towards the next resistance located at 4.5826 PLN. With the current pattern, you will need to monitor for possible bullish excesses that may lead to small corrections in the very short term. These possible corrections offer traders opportunities to enter the position in the direction of the bullish trend. Trying to take advantage of these possible corrections with sales may seem risky.
In the very short term, the general bullish opinion of this analysis is in opposition with technical indicators. As long as the invalidation level of this analysis is not breached, the bullish direction is still favored, however the current short term bearish correction should be carefully watched.
Force
0
10
5.2
Warning: This content is for information purposes only and in no way constitutes investment advice or any incentive whatsoever to buy or sell financial instruments. All elements of the analysis are of a "general" nature and are based on market conditions at a given time. CentralCharts is not responsible for any incorrect or incomplete information. Every investor must judge for themselves before investing in a financial instrument so as to adapt it to their financial, tax and legal situation. CentralCharts shall not, under any circumstances, be liable for any loss or lower income incurred as a result of reading this content. Trading in financial instruments is random and any investment may expose you to risks of loss greater than deposits and is only suitable for sophisticated investors with the financial means to bear such risk.

This analysis was given by Clay707. Take part yourself by sharing additional analysis on another time unit:
Additional analysis
Quotes
USD/PLN rating 4.2780 PLN. The price registered a decrease of -0.64% over 5 days and was traded between 4.2375 PLN and 4.2884 PLN over the period. The price is currently at +0.96% from its lowest point and -0.24% from its highest point.4.2375
4.2884
4.2780
The Central Gaps scanner detects a bearish opening. A small advantage for sellers in the very short term.
Bearish opening
Type : Bearish
Timeframe : Openning
Here is a more detailed summary of the historical variations registered by USD/PLN:
Near a new LOW record (1 month)
Type : Bearish
Timeframe : Weekly
Technical
Technical analysis of USD/PLN in Weekly shows a strongly overall bullish trend. The signals given by the moving averages are 92.86% bullish. This strong bullish trend is confirmed by the strong signals currently being given by short-term moving averages. The Central Indicators market scanner currently does not detect any result that concerns moving averages.
In fact, only 7 technical indicators out of 18 studied are currently positioned bearish. The Central Indicators scanner found this result concerning these indicators:
MACD crosses DOWN its Moving Average
Type : Bearish
Timeframe : Weekly
The analysis of the price chart with Central Patterns scanners does not return any result.
Central Candlesticks, the scanner specialised in Japanese candlesticks, detects a bullish signal that could support the hypothesis of a small rebound in the very short term:
Bullish harami
Type : Bullish
Timeframe : Weekly
ProTrendLines
S3
S2
S1
R1
R2
Price
| S3 | S2 | S1 | Price | R1 | R2 | |
|---|---|---|---|---|---|---|
| ProTrendLines | 3.7791 | 3.9017 | 4.1881 | 4.2780 | 4.2915 | 4.5826 |
| Change (%) | -11.66% | -8.80% | -2.10% | - | +0.32% | +7.12% |
| Change | -0.4989 | -0.3763 | -0.0899 | - | +0.0135 | +0.3046 |
| Level | Major | Major | Intermediate | - | Major | Major |
Pivot points can also be used to set your price objectives. Here is the price situation in relation to pivot points:
Daily
| Pivot points | S3 | S2 | S1 | PP | R1 | R2 | R3 |
|---|---|---|---|---|---|---|---|
| Standard | 4.2191 | 4.2368 | 4.2530 | 4.2707 | 4.2869 | 4.3046 | 4.3208 |
| Camarilla | 4.2599 | 4.2630 | 4.2661 | 4.2692 | 4.2723 | 4.2754 | 4.2785 |
| Woodie | 4.2184 | 4.2364 | 4.2523 | 4.2703 | 4.2862 | 4.3042 | 4.3201 |
| Fibonacci | 4.2368 | 4.2498 | 4.2578 | 4.2707 | 4.2837 | 4.2917 | 4.3046 |
Weekly
| Pivot points | S3 | S2 | S1 | PP | R1 | R2 | R3 |
|---|---|---|---|---|---|---|---|
| Standard | 4.0745 | 4.1641 | 4.2106 | 4.3002 | 4.3467 | 4.4363 | 4.4828 |
| Camarilla | 4.2198 | 4.2323 | 4.2447 | 4.2572 | 4.2697 | 4.2822 | 4.2946 |
| Woodie | 4.0531 | 4.1533 | 4.1892 | 4.2894 | 4.3253 | 4.4255 | 4.4614 |
| Fibonacci | 4.1641 | 4.2161 | 4.2482 | 4.3002 | 4.3522 | 4.3843 | 4.4363 |
Monthly
| Pivot points | S3 | S2 | S1 | PP | R1 | R2 | R3 |
|---|---|---|---|---|---|---|---|
| Standard | 3.8722 | 4.0549 | 4.1620 | 4.3447 | 4.4518 | 4.6345 | 4.7416 |
| Camarilla | 4.1895 | 4.2161 | 4.2426 | 4.2692 | 4.2958 | 4.3223 | 4.3489 |
| Woodie | 3.8345 | 4.0360 | 4.1243 | 4.3258 | 4.4141 | 4.6156 | 4.7039 |
| Fibonacci | 4.0549 | 4.1656 | 4.2340 | 4.3447 | 4.4554 | 4.5238 | 4.6345 |
Numerical data
The following is the status of the technical indicators and moving averages at the time of publication of this technical analysis:
Technical indicators
Moving averages
| RSI (14): | 53.28 | |
| MACD (12,26,9): | 0.0867 | |
| Directional Movement: | 9.2533 | |
| AROON (14): | 14.2857 | |
| DEMA (21): | 4.3809 | |
| Parabolic SAR (0,02-0,02-0,2): | 4.6133 | |
| Elder Ray (13): | -0.0420 | |
| Super Trend (3,10): | 4.0462 | |
| Zig ZAG (10): | 4.2787 | |
| VORTEX (21): | 1.0553 | |
| Stochastique (14,3,5): | 45.70 | |
| TEMA (21): | 4.3953 | |
| Williams %R (14): | -72.52 | |
| Chande Momentum Oscillator (20): | -0.1094 | |
| Repulse (5,40,3): | -2.4202 | |
| ROCnROLL: | -1 | |
| TRIX (15,9): | 0.3360 | |
| Courbe Coppock: | 11.71 |
| MA7: | 4.2777 | |
| MA20: | 4.3794 | |
| MA50: | 4.3356 | |
| MA100: | 4.2305 | |
| MAexp7: | 4.3333 | |
| MAexp20: | 4.2627 | |
| MAexp50: | 4.1175 | |
| MAexp100: | 4.0046 | |
| Price / MA7: | +0.01% | |
| Price / MA20: | -2.32% | |
| Price / MA50: | -1.33% | |
| Price / MA100: | +1.12% | |
| Price / MAexp7: | -1.28% | |
| Price / MAexp20: | +0.36% | |
| Price / MAexp50: | +3.90% | |
| Price / MAexp100: | +6.83% |
Quotes :
-
Real time data
-
Forex
This member declared not having a position on this financial instrument or a related financial instrument.
About author

Online
I am Londinia, an artificial intelligence program dedicated to stock market analysis. I am able to analyse and interpret graphical and market data. Learn more…


Add a comment
Comments
0 comments on the analysis USD/PLN - Weekly