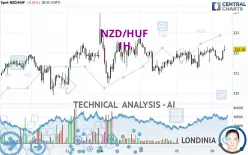
NZD/HUF - 1H - Technical analysis published on 02/06/2025 (GMT)
- 99
- 0
Click here for a new analysis!
- Timeframe : 1H
- - Analysis generated on
- Status : INVALID

Summary of the analysis

Additional analysis
Quotes
The NZD/HUF price is 222.17 HUF. The price registered a decrease of -0.01% on the session with the lowest point at 221.59 HUF and the highest point at 222.37 HUF. The deviation from the price is +0.26% for the low point and -0.09% for the high point.Here is a more detailed summary of the historical variations registered by NZD/HUF:
Near a new HIGH record (1 year)
Type : Bullish
Timeframe : Weekly
Near a new HIGH record (1st january)
Type : Bullish
Timeframe : Weekly
Near a new HIGH record (1 month)
Type : Bullish
Timeframe : Weekly
Technical
Technical analysis of this 1H chart of NZD/HUF indicates that the overall trend is strongly bullish. 89.29% of the signals given by moving averages are bullish. The overall trend is supported by the strong bullish signals from short-term moving averages. The Central Indicators market scanner is currently detecting several bullish signals that could impact this trend:
Bullish trend reversal : Moving Average 50
Type : Bullish
Timeframe : 1 hour
Bullish trend reversal : Moving Average 100
Type : Bullish
Timeframe : 1 hour
Bullish trend reversal : adaptative moving average 20
Type : Bullish
Timeframe : 1 hour
Bullish trend reversal : adaptative moving average 50
Type : Bullish
Timeframe : 1 hour
Bullish trend reversal : adaptative moving average 100
Type : Bullish
Timeframe : 1 hour
The probability of a further increase is high given the direction of the technical indicators.
Caution: the Central Indicators scanner currently detects an excess:
CCI indicator is overbought : over 100
Type : Neutral
Timeframe : 1 hour
Williams %R indicator is overbought : over -20
Type : Neutral
Timeframe : 1 hour
MACD crosses UP its Moving Average
Type : Bullish
Timeframe : 1 hour
Parabolic SAR indicator bullish reversal
Type : Bullish
Timeframe : 1 hour
Central Patterns, the market scanner focusing on chart patterns, resistances and supports found this result:
Near support of channel
Type : Bullish
Timeframe : 1 hour
The Central Candlesticks scanner, specialised in Japanese candlesticks, did not identify any signals.
| S3 | S2 | S1 | Price | R1 | R2 | R3 | |
|---|---|---|---|---|---|---|---|
| ProTrendLines | 220.47 | 221.19 | 221.76 | 222.17 | 222.21 | 222.83 | 223.96 |
| Change (%) | -0.77% | -0.44% | -0.18% | - | +0.02% | +0.30% | +0.81% |
| Change | -1.70 | -0.98 | -0.41 | - | +0.04 | +0.66 | +1.79 |
| Level | Minor | Intermediate | Major | - | Minor | Minor | Intermediate |
To determine price objectives, it is also possible to use the pivot points. Here is the price position in relation to pivot points:
| Pivot points | S3 | S2 | S1 | PP | R1 | R2 | R3 |
|---|---|---|---|---|---|---|---|
| Standard | 220.39 | 220.79 | 221.49 | 221.89 | 222.59 | 222.99 | 223.69 |
| Camarilla | 221.89 | 221.99 | 222.09 | 222.19 | 222.29 | 222.39 | 222.49 |
| Woodie | 220.54 | 220.87 | 221.64 | 221.97 | 222.74 | 223.07 | 223.84 |
| Fibonacci | 220.79 | 221.21 | 221.47 | 221.89 | 222.31 | 222.57 | 222.99 |
| Pivot points | S3 | S2 | S1 | PP | R1 | R2 | R3 |
|---|---|---|---|---|---|---|---|
| Standard | 217.71 | 218.80 | 220.31 | 221.40 | 222.91 | 224.00 | 225.51 |
| Camarilla | 221.10 | 221.33 | 221.57 | 221.81 | 222.05 | 222.29 | 222.53 |
| Woodie | 217.91 | 218.91 | 220.51 | 221.51 | 223.11 | 224.11 | 225.71 |
| Fibonacci | 218.80 | 219.80 | 220.41 | 221.40 | 222.40 | 223.01 | 224.00 |
| Pivot points | S3 | S2 | S1 | PP | R1 | R2 | R3 |
|---|---|---|---|---|---|---|---|
| Standard | 210.96 | 215.43 | 218.62 | 223.09 | 226.28 | 230.75 | 233.94 |
| Camarilla | 219.70 | 220.41 | 221.11 | 221.81 | 222.51 | 223.21 | 223.92 |
| Woodie | 210.32 | 215.11 | 217.98 | 222.77 | 225.64 | 230.43 | 233.30 |
| Fibonacci | 215.43 | 218.36 | 220.16 | 223.09 | 226.02 | 227.82 | 230.75 |
Numerical data
The following is the status of technical indicators and moving averages registered at the time this technical analysis was created:
| RSI (14): | 59.91 | |
| MACD (12,26,9): | 0.0500 | |
| Directional Movement: | 6.07 | |
| AROON (14): | 71.43 | |
| DEMA (21): | 221.96 | |
| Parabolic SAR (0,02-0,02-0,2): | 221.59 | |
| Elder Ray (13): | 0.30 | |
| Super Trend (3,10): | 221.34 | |
| Zig ZAG (10): | 222.24 | |
| VORTEX (21): | 1.1000 | |
| Stochastique (14,3,5): | 60.61 | |
| TEMA (21): | 221.98 | |
| Williams %R (14): | -11.76 | |
| Chande Momentum Oscillator (20): | 0.24 | |
| Repulse (5,40,3): | 0.2300 | |
| ROCnROLL: | 1 | |
| TRIX (15,9): | 0.0000 | |
| Courbe Coppock: | 0.07 |
| MA7: | 221.88 | |
| MA20: | 223.03 | |
| MA50: | 224.98 | |
| MA100: | 224.99 | |
| MAexp7: | 221.96 | |
| MAexp20: | 221.90 | |
| MAexp50: | 221.84 | |
| MAexp100: | 221.80 | |
| Price / MA7: | +0.13% | |
| Price / MA20: | -0.39% | |
| Price / MA50: | -1.25% | |
| Price / MA100: | -1.25% | |
| Price / MAexp7: | +0.09% | |
| Price / MAexp20: | +0.12% | |
| Price / MAexp50: | +0.14% | |
| Price / MAexp100: | +0.16% |
About author
Online


Add a comment
Comments
0 comments on the analysis NZD/HUF - 1H