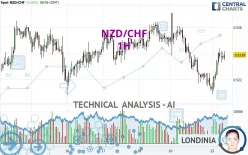
NZD/CHF - 1H - Technical analysis published on 10/22/2024 (GMT)
- 104
- 0
- Timeframe : 1H
- - Analysis generated on
- Status : NEUTRAL

Summary of the analysis

Additional analysis
Quotes
NZD/CHF rating 0.5239 CHF. On the day, this instrument gained +0.50% with the lowest point at 0.5209 CHF and the highest point at 0.5244 CHF. The deviation from the price is +0.58% for the low point and -0.10% for the high point.A study of price movements over other periods shows the following variations:
Near a new HIGH record (1 month)
Type : Bullish
Timeframe : Weekly
Technical
Technical analysis of this 1H chart of NZD/CHF indicates that the overall trend is not clearly defined. This indecision could turn into a bullish trend due to the bullish signals currently being given by short-term moving averages. An assessment of moving averages reveals a bullish signal that could impact this trend:
Bullish price crossover with adaptative moving average 100
Type : Bullish
Timeframe : 1 hour
An assessment of technical indicators shows a strong bullish signal.
Caution: the Central Indicators scanner currently detects an excess:
CCI indicator is overbought : over 100
Type : Neutral
Timeframe : 1 hour
Williams %R indicator is overbought : over -20
Type : Neutral
Timeframe : 1 hour
Price is back under the pivot point
Type : Bearish
Timeframe : Weekly
The Central Patterns scanner, which studies chart patterns, resistances and supports, has identified these signals:
Near horizontal resistance
Type : Bearish
Timeframe : 1 hour
Resistance of channel is broken
Type : Bullish
Timeframe : 1 hour
The Central Candlesticks scanner, specialised in Japanese candlesticks, did not identify any signals.
| S3 | S2 | S1 | R1 | Price | R2 | R3 | |
|---|---|---|---|---|---|---|---|
| ProTrendLines | 0.5086 | 0.5204 | 0.5221 | 0.5239 | 0.5239 | 0.5256 | 0.5271 |
| Change (%) | -2.92% | -0.67% | -0.34% | 0% | - | +0.32% | +0.61% |
| Change | -0.0153 | -0.0035 | -0.0018 | 0 | - | +0.0017 | +0.0032 |
| Level | Minor | Major | Minor | Minor | - | Major | Minor |
Attention could also be paid to pivot points to set price objectives:
| Pivot points | S3 | S2 | S1 | PP | R1 | R2 | R3 |
|---|---|---|---|---|---|---|---|
| Standard | 0.5132 | 0.5172 | 0.5192 | 0.5232 | 0.5252 | 0.5292 | 0.5312 |
| Camarilla | 0.5197 | 0.5202 | 0.5208 | 0.5213 | 0.5219 | 0.5224 | 0.5230 |
| Woodie | 0.5123 | 0.5167 | 0.5183 | 0.5227 | 0.5243 | 0.5287 | 0.5303 |
| Fibonacci | 0.5172 | 0.5195 | 0.5209 | 0.5232 | 0.5255 | 0.5269 | 0.5292 |
| Pivot points | S3 | S2 | S1 | PP | R1 | R2 | R3 |
|---|---|---|---|---|---|---|---|
| Standard | 0.5159 | 0.5184 | 0.5216 | 0.5241 | 0.5273 | 0.5298 | 0.5330 |
| Camarilla | 0.5233 | 0.5239 | 0.5244 | 0.5249 | 0.5254 | 0.5260 | 0.5265 |
| Woodie | 0.5164 | 0.5186 | 0.5221 | 0.5243 | 0.5278 | 0.5300 | 0.5335 |
| Fibonacci | 0.5184 | 0.5205 | 0.5219 | 0.5241 | 0.5262 | 0.5276 | 0.5298 |
| Pivot points | S3 | S2 | S1 | PP | R1 | R2 | R3 |
|---|---|---|---|---|---|---|---|
| Standard | 0.5019 | 0.5096 | 0.5230 | 0.5307 | 0.5441 | 0.5518 | 0.5652 |
| Camarilla | 0.5306 | 0.5325 | 0.5345 | 0.5364 | 0.5383 | 0.5403 | 0.5422 |
| Woodie | 0.5048 | 0.5110 | 0.5259 | 0.5321 | 0.5470 | 0.5532 | 0.5681 |
| Fibonacci | 0.5096 | 0.5177 | 0.5226 | 0.5307 | 0.5388 | 0.5437 | 0.5518 |
Numerical data
The following are the details of the technical indicators and moving averages that were collected to generate this technical analysis:
| RSI (14): | 57.76 | |
| MACD (12,26,9): | 0.0000 | |
| Directional Movement: | 7.3187 | |
| AROON (14): | 35.7142 | |
| DEMA (21): | 0.5227 | |
| Parabolic SAR (0,02-0,02-0,2): | 0.5217 | |
| Elder Ray (13): | 0.0009 | |
| Super Trend (3,10): | 0.5214 | |
| Zig ZAG (10): | 0.5239 | |
| VORTEX (21): | 1.0176 | |
| Stochastique (14,3,5): | 88.48 | |
| TEMA (21): | 0.5233 | |
| Williams %R (14): | -11.43 | |
| Chande Momentum Oscillator (20): | 0.0018 | |
| Repulse (5,40,3): | 0.0943 | |
| ROCnROLL: | 1 | |
| TRIX (15,9): | -0.0153 | |
| Courbe Coppock: | 0.37 |
| MA7: | 0.5238 | |
| MA20: | 0.5272 | |
| MA50: | 0.5262 | |
| MA100: | 0.5319 | |
| MAexp7: | 0.5233 | |
| MAexp20: | 0.5230 | |
| MAexp50: | 0.5236 | |
| MAexp100: | 0.5239 | |
| Price / MA7: | +0.02% | |
| Price / MA20: | -0.63% | |
| Price / MA50: | -0.44% | |
| Price / MA100: | -1.50% | |
| Price / MAexp7: | +0.11% | |
| Price / MAexp20: | +0.17% | |
| Price / MAexp50: | +0.06% | |
| Price / MAexp100: | -0% |
News
The last news published on NZD/CHF at the time of the generation of this analysis was as follows:
-
 NZD/CHF Forecast September 12, 2024
-
NZD/CHF Forecast August 19, 2024
-
NZD/CHF Forecast August 14, 2024
-
NZDCHF at key level 77.00
About author

Online


Add a comment
Comments
0 comments on the analysis NZD/CHF - 1H