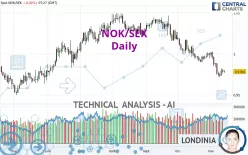
NOK/SEK - Daily - Technical analysis published on 11/14/2023 (GMT)
- 153
- 0
Click here for a new analysis!
- Timeframe : Daily
- - Analysis generated on
- Status : TARGET REACHED

Summary of the analysis

Additional analysis
Quotes
NOK/SEK rating 0.9783 SEK. The price registered a decrease of -0.03% on the session and was between 0.9764 SEK and 0.9802 SEK. This implies that the price is at +0.19% from its lowest and at -0.19% from its highest.So that you have an overall view of the price change, here is a table showing the variations over several periods:
Near a new LOW record (1 year)
Type : Bearish
Timeframe : Weekly
Near a new LOW record (1st january)
Type : Bearish
Timeframe : Weekly
Near a new HIGH record (1 month)
Type : Bullish
Timeframe : Weekly
Technical
A technical analysis in Daily of this NOK/SEK chart shows a sharp bearish trend. 92.86% of the signals given by moving averages are bearish. This strongly bearish trend is supported by the strong bearish signals given by short-term moving averages. The Central Indicators market scanner currently does not detect any result that concerns moving averages.
In fact, according to the parameters integrated into the Central Analyzer system, only 8 technical indicators out of 18 analysed are currently bearish. Central Indicators, the detector scanner for these technical indicators has recently detected several signals:
Price is back over the pivot point
Type : Bullish
Timeframe : Daily
Price is back under the pivot point
Type : Bearish
Timeframe : Weekly
The Central Patterns scanner, which studies chart patterns, resistances and supports, has identified this signal:
Near support of triangle
Type : Bullish
Timeframe : Daily
The Central Candlesticks scanner currently notes the presence of this pattern in Japanese candlesticks that could mark the end of the short-term trend currently underway:
Doji
Type : Neutral
Timeframe : Daily
| S3 | S2 | S1 | Price | R1 | R2 | R3 | |
|---|---|---|---|---|---|---|---|
| ProTrendLines | 0.9320 | 0.9523 | 0.9738 | 0.9783 | 0.9929 | 1.0083 | 1.0264 |
| Change (%) | -4.73% | -2.66% | -0.46% | - | +1.49% | +3.07% | +4.92% |
| Change | -0.0463 | -0.0260 | -0.0045 | - | +0.0146 | +0.0300 | +0.0481 |
| Level | Intermediate | Major | Major | - | Intermediate | Intermediate | Major |
To determine price objectives, it is also possible to use the pivot points. Here is the price position in relation to pivot points:
| Pivot points | S3 | S2 | S1 | PP | R1 | R2 | R3 |
|---|---|---|---|---|---|---|---|
| Standard | 0.9701 | 0.9730 | 0.9758 | 0.9787 | 0.9815 | 0.9844 | 0.9872 |
| Camarilla | 0.9770 | 0.9776 | 0.9781 | 0.9786 | 0.9791 | 0.9797 | 0.9802 |
| Woodie | 0.9701 | 0.9730 | 0.9758 | 0.9787 | 0.9815 | 0.9844 | 0.9872 |
| Fibonacci | 0.9730 | 0.9752 | 0.9765 | 0.9787 | 0.9809 | 0.9822 | 0.9844 |
| Pivot points | S3 | S2 | S1 | PP | R1 | R2 | R3 |
|---|---|---|---|---|---|---|---|
| Standard | 0.9542 | 0.9629 | 0.9713 | 0.9800 | 0.9884 | 0.9971 | 1.0055 |
| Camarilla | 0.9749 | 0.9765 | 0.9780 | 0.9796 | 0.9812 | 0.9827 | 0.9843 |
| Woodie | 0.9540 | 0.9628 | 0.9711 | 0.9799 | 0.9882 | 0.9970 | 1.0053 |
| Fibonacci | 0.9629 | 0.9695 | 0.9735 | 0.9800 | 0.9866 | 0.9906 | 0.9971 |
| Pivot points | S3 | S2 | S1 | PP | R1 | R2 | R3 |
|---|---|---|---|---|---|---|---|
| Standard | 0.9467 | 0.9682 | 0.9839 | 1.0054 | 1.0211 | 1.0426 | 1.0583 |
| Camarilla | 0.9895 | 0.9929 | 0.9963 | 0.9997 | 1.0031 | 1.0065 | 1.0099 |
| Woodie | 0.9439 | 0.9668 | 0.9811 | 1.0040 | 1.0183 | 1.0412 | 1.0555 |
| Fibonacci | 0.9682 | 0.9824 | 0.9912 | 1.0054 | 1.0196 | 1.0284 | 1.0426 |
Numerical data
The following are the details of the technical indicators and moving averages that were collected to generate this technical analysis:
| RSI (14): | 34.69 | |
| MACD (12,26,9): | -0.0087 | |
| Directional Movement: | -10.1677 | |
| AROON (14): | -35.7143 | |
| DEMA (21): | 0.9778 | |
| Parabolic SAR (0,02-0,02-0,2): | 0.9888 | |
| Elder Ray (13): | -0.0064 | |
| Super Trend (3,10): | 0.9973 | |
| Zig ZAG (10): | 0.9786 | |
| VORTEX (21): | 0.8495 | |
| Stochastique (14,3,5): | 23.15 | |
| TEMA (21): | 0.9758 | |
| Williams %R (14): | -78.14 | |
| Chande Momentum Oscillator (20): | -0.0180 | |
| Repulse (5,40,3): | -0.1569 | |
| ROCnROLL: | 2 | |
| TRIX (15,9): | -0.1171 | |
| Courbe Coppock: | 3.24 |
| MA7: | 0.9785 | |
| MA20: | 0.9897 | |
| MA50: | 1.0094 | |
| MA100: | 1.0190 | |
| MAexp7: | 0.9804 | |
| MAexp20: | 0.9892 | |
| MAexp50: | 1.0024 | |
| MAexp100: | 1.0091 | |
| Price / MA7: | -0.02% | |
| Price / MA20: | -1.15% | |
| Price / MA50: | -3.08% | |
| Price / MA100: | -3.99% | |
| Price / MAexp7: | -0.21% | |
| Price / MAexp20: | -1.10% | |
| Price / MAexp50: | -2.40% | |
| Price / MAexp100: | -3.05% |
News
Don't forget to follow the news on NOK/SEK. At the time of publication of this analysis, the latest news was as follows:
About author

Online


Add a comment
Comments
0 comments on the analysis NOK/SEK - Daily