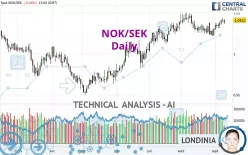
NOK/SEK - Daily - Technical analysis published on 09/11/2023 (GMT)
- 234
- 0
Click here for a new analysis!
- Timeframe : Daily
- - Analysis generated on
- Status : INVALID

Summary of the analysis

Additional analysis
Quotes
NOK/SEK rating 1.0411 SEK. The price is lower by -0.04% since the last closing and was between 1.0364 SEK and 1.0423 SEK. This implies that the price is at +0.45% from its lowest and at -0.12% from its highest.The Central Gaps scanner detects a bearish gap which is a sign that the sellers have taken the lead in the very short term.
Opening Gap DOWN
Type : Bearish
Timeframe : Openning
So that you have an overall view of the price change, here is a table showing the variations over several periods:
Near a new HIGH record (1 year)
Type : Bullish
Timeframe : Weekly
Near a new HIGH record (1st january)
Type : Bullish
Timeframe : Weekly
Near a new LOW record (1 month)
Type : Bearish
Timeframe : Weekly
Technical
Technical analysis of this Daily chart of NOK/SEK indicates that the overall trend is strongly bullish. The signals given by the moving averages are 92.86% bullish. This strong bullish trend is confirmed by the strong signals currently being given by short-term moving averages. The Central Indicators market scanner currently does not detect any result that concerns moving averages.
In fact, according to the parameters integrated into the Central Analyzer system, 14 technical indicators out of 18 analysed are currently bullish. Caution: the Central Indicators scanner currently detects an excess:
CCI indicator is overbought : over 100
Type : Neutral
Timeframe : Daily
Williams %R indicator is overbought : over -20
Type : Neutral
Timeframe : Daily
Price is back over the pivot point
Type : Bullish
Timeframe : Weekly
An analysis of the price chart with the Central Patterns scanner (detector of chart patterns and resistances and supports) shows several results that can have an impact on the price change:
Near horizontal resistance
Type : Bearish
Timeframe : Daily
Near resistance of triangle
Type : Bearish
Timeframe : Daily
Resistance of channel is broken
Type : Bullish
Timeframe : Daily
The Central Candlesticks scanner which studies Japanese candlesticks did not detect anything.
| S3 | S2 | S1 | Price | R1 | R2 | R3 | |
|---|---|---|---|---|---|---|---|
| ProTrendLines | 0.9929 | 1.0083 | 1.0264 | 1.0411 | 1.0460 | 1.0547 | 1.0695 |
| Change (%) | -4.63% | -3.15% | -1.41% | - | +0.47% | +1.31% | +2.73% |
| Change | -0.0482 | -0.0328 | -0.0147 | - | +0.0049 | +0.0136 | +0.0284 |
| Level | Major | Major | Major | - | Major | Minor | Intermediate |
To determine price objectives, it is also possible to use the pivot points. Here is the price position in relation to pivot points:
| Pivot points | S3 | S2 | S1 | PP | R1 | R2 | R3 |
|---|---|---|---|---|---|---|---|
| Standard | 1.0324 | 1.0354 | 1.0384 | 1.0414 | 1.0444 | 1.0474 | 1.0504 |
| Camarilla | 1.0399 | 1.0404 | 1.0410 | 1.0415 | 1.0421 | 1.0426 | 1.0432 |
| Woodie | 1.0325 | 1.0354 | 1.0385 | 1.0414 | 1.0445 | 1.0474 | 1.0505 |
| Fibonacci | 1.0354 | 1.0377 | 1.0391 | 1.0414 | 1.0437 | 1.0451 | 1.0474 |
| Pivot points | S3 | S2 | S1 | PP | R1 | R2 | R3 |
|---|---|---|---|---|---|---|---|
| Standard | 1.0199 | 1.0254 | 1.0334 | 1.0389 | 1.0469 | 1.0524 | 1.0604 |
| Camarilla | 1.0378 | 1.0390 | 1.0403 | 1.0415 | 1.0427 | 1.0440 | 1.0452 |
| Woodie | 1.0213 | 1.0260 | 1.0348 | 1.0395 | 1.0483 | 1.0530 | 1.0618 |
| Fibonacci | 1.0254 | 1.0305 | 1.0337 | 1.0389 | 1.0440 | 1.0472 | 1.0524 |
| Pivot points | S3 | S2 | S1 | PP | R1 | R2 | R3 |
|---|---|---|---|---|---|---|---|
| Standard | 0.9904 | 1.0061 | 1.0182 | 1.0339 | 1.0460 | 1.0617 | 1.0738 |
| Camarilla | 1.0227 | 1.0252 | 1.0278 | 1.0303 | 1.0329 | 1.0354 | 1.0380 |
| Woodie | 0.9886 | 1.0052 | 1.0164 | 1.0330 | 1.0442 | 1.0608 | 1.0720 |
| Fibonacci | 1.0061 | 1.0167 | 1.0233 | 1.0339 | 1.0445 | 1.0511 | 1.0617 |
Numerical data
The following is the status of technical indicators and moving averages registered at the time this technical analysis was created:
| RSI (14): | 59.11 | |
| MACD (12,26,9): | 0.0025 | |
| Directional Movement: | 7.2269 | |
| AROON (14): | 50.0000 | |
| DEMA (21): | 1.0373 | |
| Parabolic SAR (0,02-0,02-0,2): | 1.0261 | |
| Elder Ray (13): | 0.0039 | |
| Super Trend (3,10): | 1.0179 | |
| Zig ZAG (10): | 1.0405 | |
| VORTEX (21): | 1.0284 | |
| Stochastique (14,3,5): | 89.18 | |
| TEMA (21): | 1.0366 | |
| Williams %R (14): | -16.00 | |
| Chande Momentum Oscillator (20): | 0.0145 | |
| Repulse (5,40,3): | 0.8726 | |
| ROCnROLL: | 1 | |
| TRIX (15,9): | 0.0147 | |
| Courbe Coppock: | 1.22 |
| MA7: | 1.0377 | |
| MA20: | 1.0322 | |
| MA50: | 1.0312 | |
| MA100: | 1.0067 | |
| MAexp7: | 1.0377 | |
| MAexp20: | 1.0342 | |
| MAexp50: | 1.0274 | |
| MAexp100: | 1.0192 | |
| Price / MA7: | +0.33% | |
| Price / MA20: | +0.86% | |
| Price / MA50: | +0.96% | |
| Price / MA100: | +3.42% | |
| Price / MAexp7: | +0.33% | |
| Price / MAexp20: | +0.67% | |
| Price / MAexp50: | +1.33% | |
| Price / MAexp100: | +2.15% |
News
The last news published on NOK/SEK at the time of the generation of this analysis was as follows:
About author
Online


Add a comment
Comments
0 comments on the analysis NOK/SEK - Daily