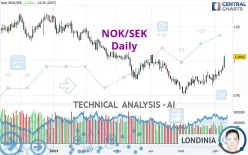
NOK/SEK - Daily - Technical analysis published on 06/09/2023 (GMT)
- 147
- 0
Click here for a new analysis!
- Timeframe : Daily
- - Analysis generated on
- Status : INVALID

Summary of the analysis

Additional analysis
Quotes
NOK/SEK rating 1.0062 SEK. On the day, this instrument gained +1.52% and was between 0.9893 SEK and 1.0077 SEK. This implies that the price is at +1.71% from its lowest and at -0.15% from its highest.So that you have an overall view of the price change, here is a table showing the variations over several periods:
Near a new LOW record (1 year)
Type : Bearish
Timeframe : Weekly
Near a new LOW record (1st january)
Type : Bearish
Timeframe : Weekly
New HIGH record (1 month)
Type : Bullish
Timeframe : Weekly
Technical
Technical analysis of this Daily chart of NOK/SEK indicates that the overall trend is slightly bullish. 60.71% of the signals given by moving averages are bullish. The overall trend could accelerate as strong bullish signals from short-term moving averages are expected. The Central Indicators market scanner is currently detecting a bullish signal that could impact this trend:
Bullish price crossover with Moving Average 100
Type : Bullish
Timeframe : Daily
In fact, 15 technical indicators on 18 studied are currently bullish. Caution: the Central Indicators scanner currently detects an excess:
RSI indicator is overbought : over 70
Type : Neutral
Timeframe : Daily
CCI indicator is overbought : over 100
Type : Neutral
Timeframe : Daily
Williams %R indicator is overbought : over -20
Type : Neutral
Timeframe : Daily
Pivot points : price is over resistance 2
Type : Neutral
Timeframe : Weekly
Pivot points : price is over resistance 3
Type : Neutral
Timeframe : Daily
Central Patterns, the market scanner focusing on chart patterns, resistances and supports found these results:
Near horizontal resistance
Type : Bearish
Timeframe : Daily
Resistance of channel is broken
Type : Bullish
Timeframe : Daily
The Central Candlesticks scanner, specialised in Japanese candlesticks, did not identify any signals.
| S3 | S2 | S1 | Price | R1 | R2 | R3 | |
|---|---|---|---|---|---|---|---|
| ProTrendLines | 0.9677 | 0.9788 | 0.9929 | 1.0062 | 1.0083 | 1.0264 | 1.0696 |
| Change (%) | -3.83% | -2.72% | -1.32% | - | +0.21% | +2.01% | +6.30% |
| Change | -0.0385 | -0.0274 | -0.0133 | - | +0.0021 | +0.0202 | +0.0634 |
| Level | Intermediate | Intermediate | Major | - | Intermediate | Major | Intermediate |
To determine price objectives, it is also possible to use the pivot points. Here is the price position in relation to pivot points:
| Pivot points | S3 | S2 | S1 | PP | R1 | R2 | R3 |
|---|---|---|---|---|---|---|---|
| Standard | 0.9786 | 0.9820 | 0.9865 | 0.9899 | 0.9944 | 0.9978 | 1.0023 |
| Camarilla | 0.9889 | 0.9897 | 0.9904 | 0.9911 | 0.9918 | 0.9926 | 0.9933 |
| Woodie | 0.9793 | 0.9823 | 0.9872 | 0.9902 | 0.9951 | 0.9981 | 1.0030 |
| Fibonacci | 0.9820 | 0.9850 | 0.9869 | 0.9899 | 0.9929 | 0.9948 | 0.9978 |
| Pivot points | S3 | S2 | S1 | PP | R1 | R2 | R3 |
|---|---|---|---|---|---|---|---|
| Standard | 0.9417 | 0.9526 | 0.9659 | 0.9768 | 0.9901 | 1.0010 | 1.0143 |
| Camarilla | 0.9725 | 0.9747 | 0.9769 | 0.9791 | 0.9813 | 0.9835 | 0.9858 |
| Woodie | 0.9428 | 0.9532 | 0.9670 | 0.9774 | 0.9912 | 1.0016 | 1.0154 |
| Fibonacci | 0.9526 | 0.9619 | 0.9676 | 0.9768 | 0.9861 | 0.9918 | 1.0010 |
| Pivot points | S3 | S2 | S1 | PP | R1 | R2 | R3 |
|---|---|---|---|---|---|---|---|
| Standard | 0.9232 | 0.9365 | 0.9581 | 0.9714 | 0.9930 | 1.0063 | 1.0279 |
| Camarilla | 0.9701 | 0.9733 | 0.9765 | 0.9797 | 0.9829 | 0.9861 | 0.9893 |
| Woodie | 0.9274 | 0.9386 | 0.9623 | 0.9735 | 0.9972 | 1.0084 | 1.0321 |
| Fibonacci | 0.9365 | 0.9498 | 0.9581 | 0.9714 | 0.9847 | 0.9930 | 1.0063 |
Numerical data
The following is the status of technical indicators and moving averages registered at the time this technical analysis was created:
| RSI (14): | 74.09 | |
| MACD (12,26,9): | 0.0049 | |
| Directional Movement: | 21.5392 | |
| AROON (14): | 57.1429 | |
| DEMA (21): | 0.9854 | |
| Parabolic SAR (0,02-0,02-0,2): | 0.9680 | |
| Elder Ray (13): | 0.0146 | |
| Super Trend (3,10): | 0.9682 | |
| Zig ZAG (10): | 1.0054 | |
| VORTEX (21): | 1.1161 | |
| Stochastique (14,3,5): | 93.74 | |
| TEMA (21): | 0.9925 | |
| Williams %R (14): | -3.89 | |
| Chande Momentum Oscillator (20): | 0.0276 | |
| Repulse (5,40,3): | 2.7202 | |
| ROCnROLL: | 1 | |
| TRIX (15,9): | 0.0277 | |
| Courbe Coppock: | 3.36 |
| MA7: | 0.9866 | |
| MA20: | 0.9777 | |
| MA50: | 0.9778 | |
| MA100: | 0.9946 | |
| MAexp7: | 0.9891 | |
| MAexp20: | 0.9806 | |
| MAexp50: | 0.9816 | |
| MAexp100: | 0.9941 | |
| Price / MA7: | +1.99% | |
| Price / MA20: | +2.92% | |
| Price / MA50: | +2.90% | |
| Price / MA100: | +1.17% | |
| Price / MAexp7: | +1.73% | |
| Price / MAexp20: | +2.61% | |
| Price / MAexp50: | +2.51% | |
| Price / MAexp100: | +1.22% |
News
Don't forget to follow the news on NOK/SEK. At the time of publication of this analysis, the latest news was as follows:
About author
Online


Add a comment
Comments
0 comments on the analysis NOK/SEK - Daily