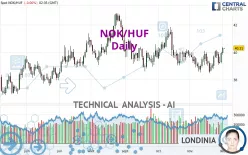
NOK/HUF - Daily - Technical analysis published on 12/02/2022 (GMT)
- 155
- 0
Click here for a new analysis!
- Timeframe : Daily
- - Analysis generated on
- Status : INVALID

Summary of the analysis

Additional analysis
Quotes
The NOK/HUF price is 40.310 HUF. The price registered a decrease of -0.01% on the session and was traded between 40.267 HUF and 40.333 HUF over the period. The price is currently at +0.11% from its lowest and -0.06% from its highest.The Central Gaps scanner detects a bearish opening marking the presence of sellers ahead of buyers at the opening but not sufficiently marked to allow the price to register a quotation gap.
Bearish opening
Type : Bearish
Timeframe : Openning
Here is a more detailed summary of the historical variations registered by NOK/HUF:
Near a new LOW record (1 month)
Type : Bearish
Timeframe : Weekly
Technical
Technical analysis of this Daily chart of NOK/HUF indicates that the overall trend is bullish. The signals returned by the moving averages are 78.57% bullish. This bullish trend is reinforced by the strong signals currently being given by short-term moving averages. An assessment of moving averages reveals a bullish signal that could impact this trend:
Bullish trend reversal : Moving Average 100
Type : Bullish
Timeframe : Daily
The probability of a further increase is high given the direction of the technical indicators.
Caution: the Central Indicators scanner currently detects an excess:
CCI indicator is overbought : over 100
Type : Neutral
Timeframe : Daily
Williams %R indicator is overbought : over -20
Type : Neutral
Timeframe : Daily
The Central Patterns scanner, which studies chart patterns, resistances and supports, has identified these signals:
Near horizontal resistance
Type : Bearish
Timeframe : Daily
Resistance of channel is broken
Type : Bullish
Timeframe : Daily
Central Candlesticks, the scanner specialised in Japanese candlesticks, detects a bearish signal that could support the hypothesis of a small drop in the very short term:
Bearish harami cross
Type : Bearish
Timeframe : Daily
| S3 | S2 | S1 | Price | R1 | R2 | R3 | |
|---|---|---|---|---|---|---|---|
| ProTrendLines | 37.770 | 38.814 | 40.090 | 40.310 | 40.877 | 41.689 | 42.750 |
| Change (%) | -6.30% | -3.71% | -0.55% | - | +1.41% | +3.42% | +6.05% |
| Change | -2.540 | -1.496 | -0.220 | - | +0.567 | +1.379 | +2.440 |
| Level | Minor | Major | Major | - | Minor | Major | Intermediate |
To determine price objectives, it is also possible to use the pivot points. Here is the price position in relation to pivot points:
| Pivot points | S3 | S2 | S1 | PP | R1 | R2 | R3 |
|---|---|---|---|---|---|---|---|
| Standard | 39.343 | 39.573 | 39.943 | 40.173 | 40.543 | 40.773 | 41.143 |
| Camarilla | 40.147 | 40.202 | 40.257 | 40.312 | 40.367 | 40.422 | 40.477 |
| Woodie | 39.412 | 39.608 | 40.012 | 40.208 | 40.612 | 40.808 | 41.212 |
| Fibonacci | 39.573 | 39.803 | 39.944 | 40.173 | 40.403 | 40.544 | 40.773 |
| Pivot points | S3 | S2 | S1 | PP | R1 | R2 | R3 |
|---|---|---|---|---|---|---|---|
| Standard | 37.276 | 37.938 | 38.852 | 39.514 | 40.428 | 41.090 | 42.004 |
| Camarilla | 39.333 | 39.477 | 39.622 | 39.766 | 39.911 | 40.055 | 40.199 |
| Woodie | 37.402 | 38.001 | 38.978 | 39.577 | 40.554 | 41.153 | 42.130 |
| Fibonacci | 37.938 | 38.540 | 38.912 | 39.514 | 40.116 | 40.488 | 41.090 |
| Pivot points | S3 | S2 | S1 | PP | R1 | R2 | R3 |
|---|---|---|---|---|---|---|---|
| Standard | 37.188 | 37.830 | 38.892 | 39.534 | 40.596 | 41.238 | 42.300 |
| Camarilla | 39.485 | 39.642 | 39.798 | 39.954 | 40.110 | 40.266 | 40.423 |
| Woodie | 37.398 | 37.935 | 39.102 | 39.639 | 40.806 | 41.343 | 42.510 |
| Fibonacci | 37.830 | 38.481 | 38.883 | 39.534 | 40.185 | 40.587 | 41.238 |
Numerical data
The following is the status of technical indicators and moving averages registered at the time this technical analysis was created:
| RSI (14): | 58.27 | |
| MACD (12,26,9): | 0.0830 | |
| Directional Movement: | 6.665 | |
| AROON (14): | 64.286 | |
| DEMA (21): | 39.672 | |
| Parabolic SAR (0,02-0,02-0,2): | 38.856 | |
| Elder Ray (13): | 0.600 | |
| Super Trend (3,10): | 40.707 | |
| Zig ZAG (10): | 40.308 | |
| VORTEX (21): | 1.0760 | |
| Stochastique (14,3,5): | 92.45 | |
| TEMA (21): | 39.880 | |
| Williams %R (14): | -4.76 | |
| Chande Momentum Oscillator (20): | 0.942 | |
| Repulse (5,40,3): | 1.4950 | |
| ROCnROLL: | 1 | |
| TRIX (15,9): | -0.0270 | |
| Courbe Coppock: | 2.80 |
| MA7: | 39.847 | |
| MA20: | 39.421 | |
| MA50: | 39.785 | |
| MA100: | 40.043 | |
| MAexp7: | 39.880 | |
| MAexp20: | 39.637 | |
| MAexp50: | 39.714 | |
| MAexp100: | 39.636 | |
| Price / MA7: | +1.16% | |
| Price / MA20: | +2.26% | |
| Price / MA50: | +1.32% | |
| Price / MA100: | +0.67% | |
| Price / MAexp7: | +1.08% | |
| Price / MAexp20: | +1.70% | |
| Price / MAexp50: | +1.50% | |
| Price / MAexp100: | +1.70% |
About author
Online


Add a comment
Comments
0 comments on the analysis NOK/HUF - Daily