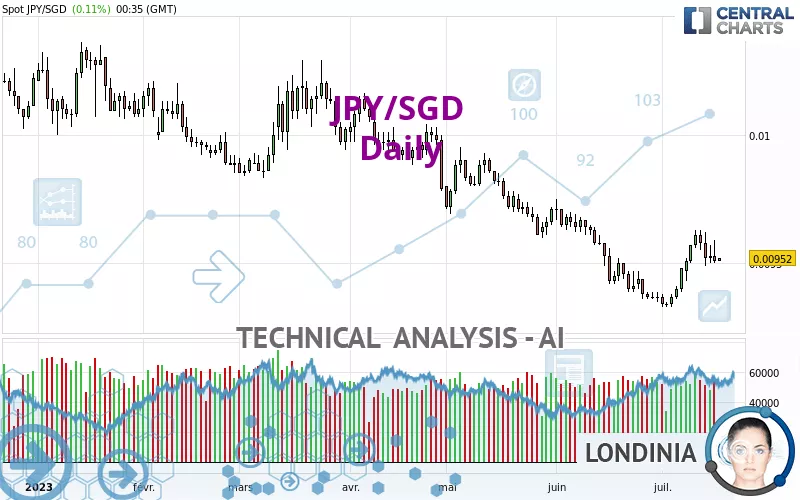
JPY/SGD - Daily - Technical analysis published on 07/19/2023 (GMT)
- 155
- 0
Click here for a new analysis!
- Timeframe : Daily
- - Analysis generated on
- Status : TARGET REACHED
Summary of the analysis

Additional analysis
Quotes
JPY/SGD rating 0.00952 SGD. The price has increased by +0.11% since the last closing with the lowest point at 0.00951 SGD and the highest point at 0.00952 SGD. The deviation from the price is +0.11% for the low point and 0% for the high point.Here is a more detailed summary of the historical variations registered by JPY/SGD:
Near a new LOW record (5 years)
Type : Bearish
Timeframe : Weekly
Near a new LOW record (1 year)
Type : Bearish
Timeframe : Weekly
Near a new LOW record (1st january)
Type : Bearish
Timeframe : Weekly
Near a new LOW record (1 month)
Type : Bearish
Timeframe : Weekly
Technical
Technical analysis of JPY/SGD in Daily shows an overall bearish trend. 71.43% of the signals given by moving averages are bearish. Caution: as the signals currently given by short-term moving averages are rather neutral, the bearish trend could slow down. The Central Indicators market scanner currently does not detect any result that concerns moving averages.
An assessment of technical indicators shows a slightly bullish signal.
Central Indicators, the scanner specialised in technical indicators, has identified this signal:
RSI indicator is back over 50
Type : Bullish
Timeframe : Daily
The Central Patterns scanner, which studies chart patterns, resistances and supports, has identified this signal:
Near horizontal support
Type : Bullish
Timeframe : Daily
There is also a Japanese candlestick pattern detected by Central Candlesticks that could mark the end of the current short-term trend:
Doji
Type : Neutral
Timeframe : Daily
| S2 | S1 | Price | R1 | R2 | R3 | |
|---|---|---|---|---|---|---|
| ProTrendLines | 0.00934 | 0.00949 | 0.00952 | 0.00971 | 0.00985 | 0.01008 |
| Change (%) | -1.89% | -0.32% | - | +2.00% | +3.47% | +5.88% |
| Change | -0.00018 | -0.00003 | - | +0.00019 | +0.00033 | +0.00056 |
| Level | Major | Major | - | Intermediate | Intermediate | Minor |
To determine price objectives, it is also possible to use the pivot points. Here is the price position in relation to pivot points:
| Pivot points | S3 | S2 | S1 | PP | R1 | R2 | R3 |
|---|---|---|---|---|---|---|---|
| Standard | 0.00939 | 0.00944 | 0.00948 | 0.00953 | 0.00957 | 0.00962 | 0.00966 |
| Camarilla | 0.00949 | 0.00949 | 0.00950 | 0.00951 | 0.00952 | 0.00953 | 0.00954 |
| Woodie | 0.00938 | 0.00944 | 0.00947 | 0.00953 | 0.00956 | 0.00962 | 0.00965 |
| Fibonacci | 0.00944 | 0.00948 | 0.00950 | 0.00953 | 0.00957 | 0.00959 | 0.00962 |
| Pivot points | S3 | S2 | S1 | PP | R1 | R2 | R3 |
|---|---|---|---|---|---|---|---|
| Standard | 0.00922 | 0.00933 | 0.00942 | 0.00953 | 0.00962 | 0.00973 | 0.00982 |
| Camarilla | 0.00947 | 0.00948 | 0.00950 | 0.00952 | 0.00954 | 0.00956 | 0.00958 |
| Woodie | 0.00922 | 0.00933 | 0.00942 | 0.00953 | 0.00962 | 0.00973 | 0.00982 |
| Fibonacci | 0.00933 | 0.00940 | 0.00945 | 0.00953 | 0.00960 | 0.00965 | 0.00973 |
| Pivot points | S3 | S2 | S1 | PP | R1 | R2 | R3 |
|---|---|---|---|---|---|---|---|
| Standard | 0.00883 | 0.00909 | 0.00923 | 0.00949 | 0.00963 | 0.00989 | 0.01003 |
| Camarilla | 0.00926 | 0.00930 | 0.00933 | 0.00937 | 0.00941 | 0.00944 | 0.00948 |
| Woodie | 0.00877 | 0.00906 | 0.00917 | 0.00946 | 0.00957 | 0.00986 | 0.00997 |
| Fibonacci | 0.00909 | 0.00924 | 0.00934 | 0.00949 | 0.00964 | 0.00974 | 0.00989 |
Numerical data
The following is the status of the technical indicators and moving averages at the time of publication of this technical analysis:
| RSI (14): | 50.86 | |
| MACD (12,26,9): | 0.0000 | |
| Directional Movement: | 6.49045 | |
| AROON (14): | 50.00000 | |
| DEMA (21): | 0.00948 | |
| Parabolic SAR (0,02-0,02-0,2): | 0.00945 | |
| Elder Ray (13): | 0.00002 | |
| Super Trend (3,10): | 0.00940 | |
| Zig ZAG (10): | 0.00952 | |
| VORTEX (21): | 1.0597 | |
| Stochastique (14,3,5): | 63.33 | |
| TEMA (21): | 0.00953 | |
| Williams %R (14): | -36.67 | |
| Chande Momentum Oscillator (20): | 0.00018 | |
| Repulse (5,40,3): | -0.3707 | |
| ROCnROLL: | -1 | |
| TRIX (15,9): | -0.0447 | |
| Courbe Coppock: | 3.12 |
| MA7: | 0.00955 | |
| MA20: | 0.00945 | |
| MA50: | 0.00958 | |
| MA100: | 0.00978 | |
| MAexp7: | 0.00952 | |
| MAexp20: | 0.00950 | |
| MAexp50: | 0.00958 | |
| MAexp100: | 0.00971 | |
| Price / MA7: | -0.31% | |
| Price / MA20: | +0.74% | |
| Price / MA50: | -0.63% | |
| Price / MA100: | -2.66% | |
| Price / MAexp7: | -0% | |
| Price / MAexp20: | +0.21% | |
| Price / MAexp50: | -0.63% | |
| Price / MAexp100: | -1.96% |
About author
Online


Add a comment
Comments
0 comments on the analysis JPY/SGD - Daily