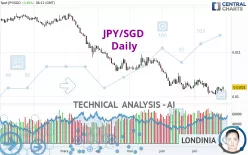
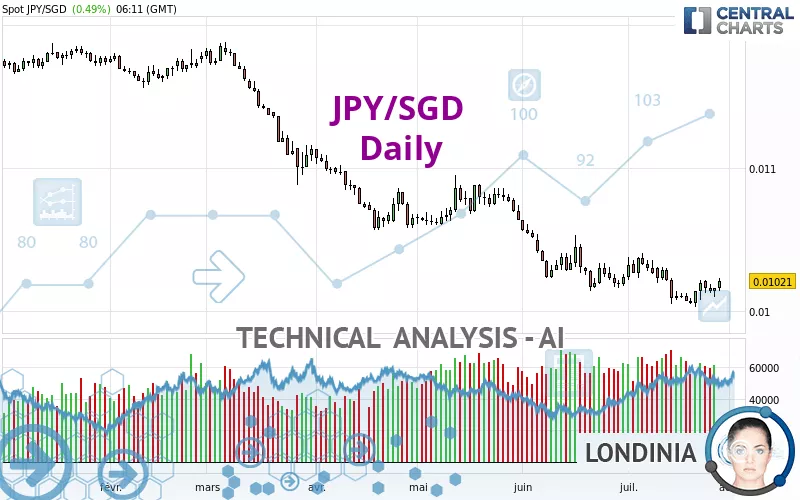
JPY/SGD - Daily - Technical analysis published on 07/28/2022 (GMT)
- 200
- 0
Click here for a new analysis!
- Timeframe : Daily
- - Analysis generated on
- Status : INVALID
Summary of the analysis

Additional analysis
Quotes
The JPY/SGD price is 0.01021 SGD. The price has increased by +0.49% since the last closing with the lowest point at 0.01014 SGD and the highest point at 0.01023 SGD. The deviation from the price is +0.69% for the low point and -0.20% for the high point.So that you have an overall view of the price change, here is a table showing the variations over several periods:
Near a new LOW record (5 years)
Type : Bearish
Timeframe : Weekly
Near a new LOW record (1 year)
Type : Bearish
Timeframe : Weekly
Near a new LOW record (1st january)
Type : Bearish
Timeframe : Weekly
Near a new HIGH record (1 month)
Type : Bullish
Timeframe : Weekly
Technical
Technical analysis of this Daily chart of JPY/SGD indicates that the overall trend is bearish. The signals given by moving averages are 75.00% bearish. This bearish trend could slow down given the neutral signals currently being given by short-term moving averages. The Central Indicators scanner detects a bullish signal on moving averages that could impact this trend:
Bullish price crossover with Moving Average 20
Type : Bullish
Timeframe : Daily
The probability of a further increase is slight given the direction of the technical indicators.
Other results related to technical indicators were also found by the Central Indicators scanner:
Pivot points : price is over resistance 2
Type : Neutral
Timeframe : Daily
Williams %R indicator is back over -50
Type : Bullish
Timeframe : Daily
The Central Patterns scanner, which studies chart patterns, resistances and supports, has identified these signals:
Near resistance of channel
Type : Bearish
Timeframe : Daily
Horizontal resistance is broken
Type : Bullish
Timeframe : Daily
The Central Candlesticks scanner which studies Japanese candlesticks did not detect anything.
| S1 | Price | R1 | R2 | R3 | |
|---|---|---|---|---|---|
| ProTrendLines | 0.01017 | 0.01021 | 0.01058 | 0.01184 | 0.01203 |
| Change (%) | -0.39% | - | +3.62% | +15.96% | +17.83% |
| Change | -0.00004 | - | +0.00037 | +0.00163 | +0.00182 |
| Level | Intermediate | - | Minor | Intermediate | Major |
To determine price objectives, it is also possible to use the pivot points. Here is the price position in relation to pivot points:
| Pivot points | S3 | S2 | S1 | PP | R1 | R2 | R3 |
|---|---|---|---|---|---|---|---|
| Standard | 0.01006 | 0.01008 | 0.01012 | 0.01014 | 0.01018 | 0.01020 | 0.01024 |
| Camarilla | 0.01014 | 0.01015 | 0.01016 | 0.01016 | 0.01017 | 0.01017 | 0.01018 |
| Woodie | 0.01007 | 0.01009 | 0.01013 | 0.01015 | 0.01019 | 0.01021 | 0.01025 |
| Fibonacci | 0.01008 | 0.01010 | 0.01012 | 0.01014 | 0.01016 | 0.01018 | 0.01020 |
| Pivot points | S3 | S2 | S1 | PP | R1 | R2 | R3 |
|---|---|---|---|---|---|---|---|
| Standard | 0.00989 | 0.00996 | 0.01008 | 0.01015 | 0.01027 | 0.01034 | 0.01046 |
| Camarilla | 0.01015 | 0.01017 | 0.01018 | 0.01020 | 0.01022 | 0.01024 | 0.01025 |
| Woodie | 0.00992 | 0.00997 | 0.01011 | 0.01016 | 0.01030 | 0.01035 | 0.01049 |
| Fibonacci | 0.00996 | 0.01003 | 0.01008 | 0.01015 | 0.01022 | 0.01027 | 0.01034 |
| Pivot points | S3 | S2 | S1 | PP | R1 | R2 | R3 |
|---|---|---|---|---|---|---|---|
| Standard | 0.00954 | 0.00984 | 0.01004 | 0.01034 | 0.01054 | 0.01084 | 0.01104 |
| Camarilla | 0.01010 | 0.01015 | 0.01019 | 0.01024 | 0.01029 | 0.01033 | 0.01038 |
| Woodie | 0.00949 | 0.00982 | 0.00999 | 0.01032 | 0.01049 | 0.01082 | 0.01099 |
| Fibonacci | 0.00984 | 0.01003 | 0.01015 | 0.01034 | 0.01053 | 0.01065 | 0.01084 |
Numerical data
The following is the status of technical indicators and moving averages registered at the time this technical analysis was created:
| RSI (14): | 48.74 | |
| MACD (12,26,9): | -0.0001 | |
| Directional Movement: | -0.12228 | |
| AROON (14): | -64.28571 | |
| DEMA (21): | 0.01012 | |
| Parabolic SAR (0,02-0,02-0,2): | 0.01026 | |
| Elder Ray (13): | 0.00002 | |
| Super Trend (3,10): | 0.01034 | |
| Zig ZAG (10): | 0.01021 | |
| VORTEX (21): | 0.9899 | |
| Stochastique (14,3,5): | 45.67 | |
| TEMA (21): | 0.01014 | |
| Williams %R (14): | -35.71 | |
| Chande Momentum Oscillator (20): | -0.00008 | |
| Repulse (5,40,3): | 0.9541 | |
| ROCnROLL: | -1 | |
| TRIX (15,9): | -0.0899 | |
| Courbe Coppock: | 2.51 |
| MA7: | 0.01015 | |
| MA20: | 0.01020 | |
| MA50: | 0.01034 | |
| MA100: | 0.01063 | |
| MAexp7: | 0.01017 | |
| MAexp20: | 0.01020 | |
| MAexp50: | 0.01035 | |
| MAexp100: | 0.01064 | |
| Price / MA7: | +0.59% | |
| Price / MA20: | +0.10% | |
| Price / MA50: | -1.26% | |
| Price / MA100: | -3.95% | |
| Price / MAexp7: | +0.39% | |
| Price / MAexp20: | +0.10% | |
| Price / MAexp50: | -1.35% | |
| Price / MAexp100: | -4.04% |
About author
Online


Add a comment
Comments
0 comments on the analysis JPY/SGD - Daily