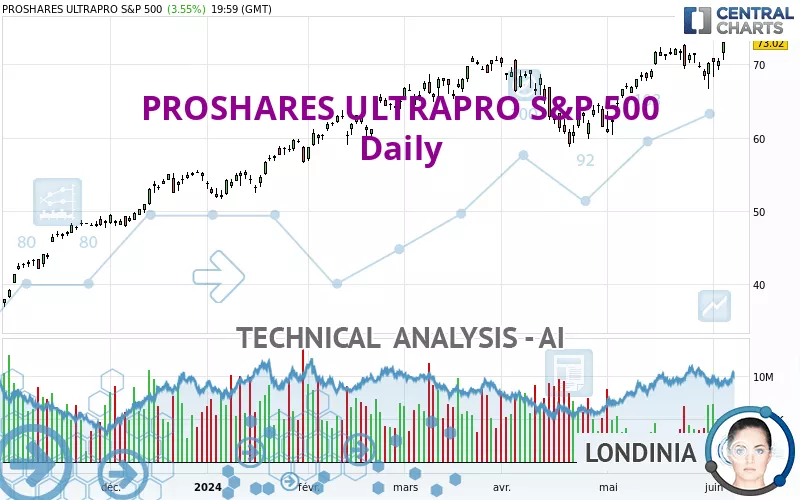
PROSHARES ULTRAPRO S&P 500 - Daily - Technical analysis published on 06/06/2024 (GMT)
- 131
- 0
Click here for a new analysis!
- Timeframe : Daily
- - Analysis generated on
- Status : TARGET REACHED

Summary of the analysis

Additional analysis
Quotes
PROSHARES ULTRAPRO S&P 500 rating 73.02 USD. On the day, this instrument gained +3.55% and was traded between 70.65 USD and 73.05 USD over the period. The price is currently at +3.35% from its lowest and -0.04% from its highest.A bullish gap was detected at the opening by the Central Gaps scanner. There are a lot of buyers and they have the upper hand in the very short term.
Opening Gap UP
Type : Bullish
Timeframe : Openning
So that you have an overall view of the price change, here is a table showing the variations over several periods:
New HIGH record (1 year)
Type : Bullish
Timeframe : Weekly
New HIGH record (1st january)
Type : Bullish
Timeframe : Weekly
New HIGH record (1 month)
Type : Bullish
Timeframe : Weekly
Technical
Technical analysis of this Daily chart of PROSHARES ULTRAPRO S&P 500 indicates that the overall trend is strongly bullish. 92.86% of the signals given by moving averages are bullish. The overall trend is supported by the strong bullish signals from short-term moving averages. The Central Indicators market scanner currently does not detect any result that concerns moving averages.
In fact, according to the parameters integrated into the Central Analyzer system, 13 technical indicators out of 18 analysed are currently bullish. Caution: the Central Indicators scanner currently detects an excess:
CCI indicator is overbought : over 100
Type : Neutral
Timeframe : Daily
Williams %R indicator is overbought : over -20
Type : Neutral
Timeframe : Daily
Parabolic SAR indicator bullish reversal
Type : Bullish
Timeframe : Daily
Aroon indicator bullish trend
Type : Bullish
Timeframe : Daily
Momentum indicator is back over 0
Type : Bullish
Timeframe : Daily
Central Patterns, the scanner specializing in chart patterns, did not identify any signals.
The Central Candlesticks scanner, specialised in Japanese candlesticks, did not identify any signals.
| S3 | S2 | S1 | Price | R1 | |
|---|---|---|---|---|---|
| ProTrendLines | 51.62 | 56.61 | 70.59 | 73.02 | 77.61 |
| Change (%) | -29.31% | -22.47% | -3.33% | - | +6.29% |
| Change | -21.40 | -16.41 | -2.43 | - | +4.59 |
| Level | Minor | Major | Intermediate | - | Major |
Pivot points can also be used to set your price objectives. Here is the price situation in relation to pivot points:
| Pivot points | S3 | S2 | S1 | PP | R1 | R2 | R3 |
|---|---|---|---|---|---|---|---|
| Standard | 69.03 | 69.84 | 71.43 | 72.24 | 73.83 | 74.64 | 76.23 |
| Camarilla | 72.36 | 72.58 | 72.80 | 73.02 | 73.24 | 73.46 | 73.68 |
| Woodie | 69.42 | 70.04 | 71.82 | 72.44 | 74.22 | 74.84 | 76.62 |
| Fibonacci | 69.84 | 70.76 | 71.32 | 72.24 | 73.16 | 73.72 | 74.64 |
| Pivot points | S3 | S2 | S1 | PP | R1 | R2 | R3 |
|---|---|---|---|---|---|---|---|
| Standard | 62.40 | 64.52 | 67.35 | 69.47 | 72.30 | 74.42 | 77.25 |
| Camarilla | 68.81 | 69.26 | 69.72 | 70.17 | 70.62 | 71.08 | 71.53 |
| Woodie | 62.75 | 64.70 | 67.70 | 69.65 | 72.65 | 74.60 | 77.60 |
| Fibonacci | 64.52 | 66.41 | 67.58 | 69.47 | 71.36 | 72.53 | 74.42 |
| Pivot points | S3 | S2 | S1 | PP | R1 | R2 | R3 |
|---|---|---|---|---|---|---|---|
| Standard | 50.47 | 55.43 | 62.80 | 67.76 | 75.13 | 80.09 | 87.46 |
| Camarilla | 66.78 | 67.91 | 69.04 | 70.17 | 71.30 | 72.43 | 73.56 |
| Woodie | 51.68 | 56.03 | 64.01 | 68.36 | 76.34 | 80.69 | 88.67 |
| Fibonacci | 55.43 | 60.14 | 63.05 | 67.76 | 72.47 | 75.38 | 80.09 |
Numerical data
The following is the status of the technical indicators and moving averages at the time of publication of this technical analysis:
| RSI (14): | 64.04 | |
| MACD (12,26,9): | 1.3100 | |
| Directional Movement: | 3.25 | |
| AROON (14): | 21.43 | |
| DEMA (21): | 71.47 | |
| Parabolic SAR (0,02-0,02-0,2): | 66.65 | |
| Elder Ray (13): | 1.44 | |
| Super Trend (3,10): | 66.94 | |
| Zig ZAG (10): | 73.02 | |
| VORTEX (21): | 1.0800 | |
| Stochastique (14,3,5): | 74.69 | |
| TEMA (21): | 71.93 | |
| Williams %R (14): | -0.47 | |
| Chande Momentum Oscillator (20): | 1.58 | |
| Repulse (5,40,3): | 6.1500 | |
| ROCnROLL: | 1 | |
| TRIX (15,9): | 0.3100 | |
| Courbe Coppock: | 4.07 |
| MA7: | 70.51 | |
| MA20: | 70.22 | |
| MA50: | 67.20 | |
| MA100: | 64.92 | |
| MAexp7: | 70.94 | |
| MAexp20: | 69.72 | |
| MAexp50: | 67.54 | |
| MAexp100: | 64.18 | |
| Price / MA7: | +3.56% | |
| Price / MA20: | +3.99% | |
| Price / MA50: | +8.66% | |
| Price / MA100: | +12.48% | |
| Price / MAexp7: | +2.93% | |
| Price / MAexp20: | +4.73% | |
| Price / MAexp50: | +8.11% | |
| Price / MAexp100: | +13.77% |
About author

Online


Add a comment
Comments
0 comments on the analysis PROSHARES ULTRAPRO S&P 500 - Daily