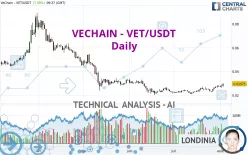
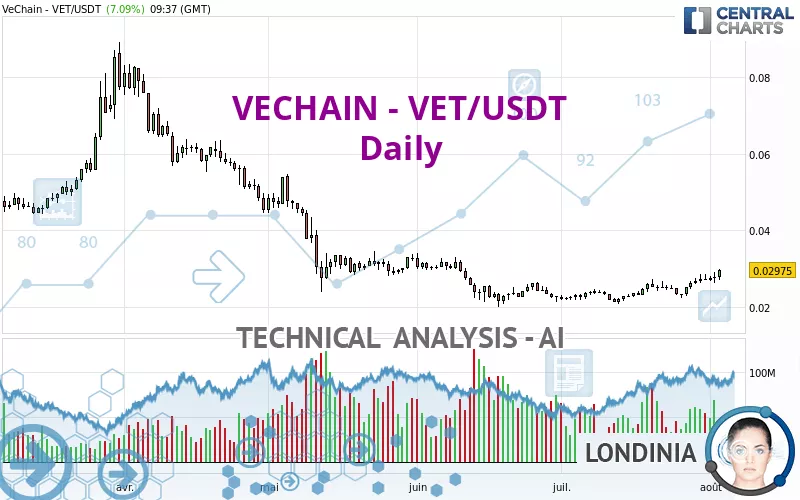
VECHAIN - VET/USDT - Daily - Technical analysis published on 08/03/2022 (GMT)
- 232
- 0
Click here for a new analysis!
- Timeframe : Daily
- - Analysis generated on
- Status : TARGET REACHED
Summary of the analysis

Additional analysis
Quotes
The VECHAIN - VET/USDT price is 0.029750 USDT. The price registered an increase of +7.09% on the session with the lowest point at 0.027120 USDT and the highest point at 0.029940 USDT. The deviation from the price is +9.70% for the low point and -0.63% for the high point.The Central Gaps scanner detects a bullish opening. A small advantage for buyers in the very short term.
Bullish opening
Type : Bullish
Timeframe : Openning
So that you have an overall view of the price change, here is a table showing the variations over several periods:
New HIGH record (1 month)
Type : Bullish
Timeframe : Weekly
Technical
A technical analysis in Daily of this VECHAIN - VET/USDT chart shows a neutral trend. The trend could quickly turn bullish due to the strong bullish signals currently being given by short-term moving averages. The Central Indicators market scanner is currently detecting a bullish signal that could impact this trend:
Bullish price crossover with adaptative moving average 100
Type : Bullish
Timeframe : Daily
Technical indicators are strongly bullish, suggesting that the price increase should continue.
Caution: the Central Indicators scanner currently detects an excess:
RSI indicator is overbought : over 70
Type : Neutral
Timeframe : Daily
CCI indicator is overbought : over 100
Type : Neutral
Timeframe : Daily
Williams %R indicator is overbought : over -20
Type : Neutral
Timeframe : Daily
Pivot points : price is over resistance 1
Type : Neutral
Timeframe : Daily
The analysis of the price chart with Central Patterns scanners does not return any result.
The Central Candlesticks scanner, specialised in Japanese candlesticks, did not identify any signals.
| S1 | Price | R1 | R2 | R3 | |
|---|---|---|---|---|---|
| ProTrendLines | 0.021608 | 0.029750 | 0.044593 | 0.067700 | 0.085189 |
| Change (%) | -27.37% | - | +49.89% | +127.56% | +186.35% |
| Change | -0.008142 | - | +0.014843 | +0.037950 | +0.055439 |
| Level | Major | - | Intermediate | Minor | Intermediate |
To determine price objectives, it is also possible to use the pivot points. Here is the price position in relation to pivot points:
| Pivot points | S3 | S2 | S1 | PP | R1 | R2 | R3 |
|---|---|---|---|---|---|---|---|
| Standard | 0.023210 | 0.024720 | 0.026250 | 0.027760 | 0.029290 | 0.030800 | 0.032330 |
| Camarilla | 0.026944 | 0.027223 | 0.027501 | 0.027780 | 0.028059 | 0.028337 | 0.028616 |
| Woodie | 0.023220 | 0.024725 | 0.026260 | 0.027765 | 0.029300 | 0.030805 | 0.032340 |
| Fibonacci | 0.024720 | 0.025881 | 0.026599 | 0.027760 | 0.028921 | 0.029639 | 0.030800 |
| Pivot points | S3 | S2 | S1 | PP | R1 | R2 | R3 |
|---|---|---|---|---|---|---|---|
| Standard | 0.017760 | 0.020140 | 0.023760 | 0.026140 | 0.029760 | 0.032140 | 0.035760 |
| Camarilla | 0.025730 | 0.026280 | 0.026830 | 0.027380 | 0.027930 | 0.028480 | 0.029030 |
| Woodie | 0.018380 | 0.020450 | 0.024380 | 0.026450 | 0.030380 | 0.032450 | 0.036380 |
| Fibonacci | 0.020140 | 0.022432 | 0.023848 | 0.026140 | 0.028432 | 0.029848 | 0.032140 |
| Pivot points | S3 | S2 | S1 | PP | R1 | R2 | R3 |
|---|---|---|---|---|---|---|---|
| Standard | 0.014680 | 0.017760 | 0.022450 | 0.025530 | 0.030220 | 0.033300 | 0.037990 |
| Camarilla | 0.025003 | 0.025716 | 0.026428 | 0.027140 | 0.027852 | 0.028565 | 0.029277 |
| Woodie | 0.015485 | 0.018163 | 0.023255 | 0.025933 | 0.031025 | 0.033703 | 0.038795 |
| Fibonacci | 0.017760 | 0.020728 | 0.022562 | 0.025530 | 0.028498 | 0.030332 | 0.033300 |
Numerical data
The following are the details of the technical indicators and moving averages that were collected to generate this technical analysis:
| RSI (14): | 70.83 | |
| MACD (12,26,9): | 0.0011 | |
| Directional Movement: | 18.709524 | |
| AROON (14): | 57.142857 | |
| DEMA (21): | 0.027108 | |
| Parabolic SAR (0,02-0,02-0,2): | 0.023985 | |
| Elder Ray (13): | 0.001906 | |
| Super Trend (3,10): | 0.023026 | |
| Zig ZAG (10): | 0.029690 | |
| VORTEX (21): | 1.1773 | |
| Stochastique (14,3,5): | 86.25 | |
| TEMA (21): | 0.028437 | |
| Williams %R (14): | -3.23 | |
| Chande Momentum Oscillator (20): | 0.004420 | |
| Repulse (5,40,3): | 10.8931 | |
| ROCnROLL: | 1 | |
| TRIX (15,9): | 0.3751 | |
| Courbe Coppock: | 23.42 |
| MA7: | 0.027529 | |
| MA20: | 0.025567 | |
| MA50: | 0.024236 | |
| MA100: | 0.029761 | |
| MAexp7: | 0.027573 | |
| MAexp20: | 0.025983 | |
| MAexp50: | 0.026405 | |
| MAexp100: | 0.032197 | |
| Price / MA7: | +8.07% | |
| Price / MA20: | +16.36% | |
| Price / MA50: | +22.75% | |
| Price / MA100: | -0.04% | |
| Price / MAexp7: | +7.90% | |
| Price / MAexp20: | +14.50% | |
| Price / MAexp50: | +12.67% | |
| Price / MAexp100: | -7.60% |
About author

Online


Add a comment
Comments
0 comments on the analysis VECHAIN - VET/USDT - Daily