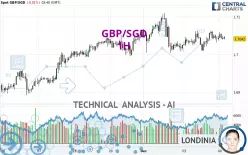
GBP/SGD - 1H - Technical analysis published on 12/04/2024 (GMT)
- 110
- 0
Click here for a new analysis!
- Timeframe : 1H
- - Analysis generated on
- Status : TARGET REACHED

Summary of the analysis

Additional analysis
Quotes
The GBP/SGD rating is 1.7042 SGD. The price is lower by -0.01% since the last closing and was traded between 1.7039 SGD and 1.7060 SGD over the period. The price is currently at +0.02% from its lowest and -0.11% from its highest.A bullish opening was detected by the Central Gaps scanner. Buyers are trying to impose a bullish momentum in the very short term.
Bullish opening
Type : Bullish
Timeframe : Openning
Here is a more detailed summary of the historical variations registered by GBP/SGD:
Near a new HIGH record (1 year)
Type : Bullish
Timeframe : Weekly
Near a new HIGH record (1st january)
Type : Bullish
Timeframe : Weekly
Near a new HIGH record (1 month)
Type : Bullish
Timeframe : Weekly
Technical
Technical analysis of GBP/SGD in 1H shows an overall bullish trend. The signals given by moving averages are 64.29% bullish. This bullish trend could slow down given the neutral signals currently being given by short-term moving averages. The Central Indicators scanner detects bullish and bearish signals on moving averages that could impact this trend:
Bullish price crossover with Moving Average 50
Type : Bullish
Timeframe : 1 hour
Bullish price crossover with adaptative moving average 20
Type : Bullish
Timeframe : 1 hour
Bearish price crossover with adaptative moving average 50
Type : Bearish
Timeframe : 1 hour
In fact, according to the parameters integrated into the Central Analyzer system, only 7 technical indicators out of 18 analysed are currently bullish. Other results related to technical indicators were also found by the Central Indicators scanner:
RSI indicator is back under 50
Type : Bearish
Timeframe : 1 hour
Ichimoku : price is under the cloud
Type : Bearish
Timeframe : 1 hour
Williams %R indicator is back under -50
Type : Bearish
Timeframe : 1 hour
An analysis of the price chart with the Central Patterns scanner (detector of chart patterns and resistances and supports) shows a result that can have an impact on the price change:
Near resistance of triangle
Type : Bearish
Timeframe : 1 hour
The Central Candlesticks scanner, specialised in Japanese candlesticks, did not identify any signals.
| S3 | S2 | S1 | Price | R1 | R2 | R3 | |
|---|---|---|---|---|---|---|---|
| ProTrendLines | 1.6897 | 1.6936 | 1.7022 | 1.7042 | 1.7064 | 1.7084 | 1.7110 |
| Change (%) | -0.85% | -0.62% | -0.12% | - | +0.13% | +0.25% | +0.40% |
| Change | -0.0145 | -0.0106 | -0.0020 | - | +0.0022 | +0.0042 | +0.0068 |
| Level | Minor | Intermediate | Intermediate | - | Minor | Minor | Intermediate |
Attention could also be paid to pivot points to set price objectives:
| Pivot points | S3 | S2 | S1 | PP | R1 | R2 | R3 |
|---|---|---|---|---|---|---|---|
| Standard | 1.6961 | 1.6985 | 1.7015 | 1.7039 | 1.7069 | 1.7093 | 1.7123 |
| Camarilla | 1.7029 | 1.7034 | 1.7039 | 1.7044 | 1.7049 | 1.7054 | 1.7059 |
| Woodie | 1.6963 | 1.6987 | 1.7017 | 1.7041 | 1.7071 | 1.7095 | 1.7125 |
| Fibonacci | 1.6985 | 1.7006 | 1.7019 | 1.7039 | 1.7060 | 1.7073 | 1.7093 |
| Pivot points | S3 | S2 | S1 | PP | R1 | R2 | R3 |
|---|---|---|---|---|---|---|---|
| Standard | 1.6767 | 1.6830 | 1.6939 | 1.7002 | 1.7111 | 1.7174 | 1.7283 |
| Camarilla | 1.7002 | 1.7018 | 1.7033 | 1.7049 | 1.7065 | 1.7081 | 1.7096 |
| Woodie | 1.6791 | 1.6842 | 1.6963 | 1.7014 | 1.7135 | 1.7186 | 1.7307 |
| Fibonacci | 1.6830 | 1.6895 | 1.6936 | 1.7002 | 1.7067 | 1.7108 | 1.7174 |
| Pivot points | S3 | S2 | S1 | PP | R1 | R2 | R3 |
|---|---|---|---|---|---|---|---|
| Standard | 1.6487 | 1.6669 | 1.6859 | 1.7041 | 1.7231 | 1.7413 | 1.7603 |
| Camarilla | 1.6947 | 1.6981 | 1.7015 | 1.7049 | 1.7083 | 1.7117 | 1.7151 |
| Woodie | 1.6491 | 1.6671 | 1.6863 | 1.7043 | 1.7235 | 1.7415 | 1.7607 |
| Fibonacci | 1.6669 | 1.6811 | 1.6899 | 1.7041 | 1.7183 | 1.7271 | 1.7413 |
Numerical data
The following are the details of the technical indicators and moving averages that were collected to generate this technical analysis:
| RSI (14): | 51.05 | |
| MACD (12,26,9): | 0.0002 | |
| Directional Movement: | 1.7710 | |
| AROON (14): | 35.7143 | |
| DEMA (21): | 1.7046 | |
| Parabolic SAR (0,02-0,02-0,2): | 1.7019 | |
| Elder Ray (13): | 0.0002 | |
| Super Trend (3,10): | 1.7073 | |
| Zig ZAG (10): | 1.7047 | |
| VORTEX (21): | 1.0510 | |
| Stochastique (14,3,5): | 61.23 | |
| TEMA (21): | 1.7048 | |
| Williams %R (14): | -46.67 | |
| Chande Momentum Oscillator (20): | 0.0008 | |
| Repulse (5,40,3): | -0.0625 | |
| ROCnROLL: | -1 | |
| TRIX (15,9): | 0.0015 | |
| Courbe Coppock: | 0.15 |
| MA7: | 1.7016 | |
| MA20: | 1.7016 | |
| MA50: | 1.7072 | |
| MA100: | 1.7095 | |
| MAexp7: | 1.7045 | |
| MAexp20: | 1.7043 | |
| MAexp50: | 1.7039 | |
| MAexp100: | 1.7027 | |
| Price / MA7: | +0.15% | |
| Price / MA20: | +0.15% | |
| Price / MA50: | -0.18% | |
| Price / MA100: | -0.31% | |
| Price / MAexp7: | -0.02% | |
| Price / MAexp20: | -0.01% | |
| Price / MAexp50: | +0.02% | |
| Price / MAexp100: | +0.09% |
About author
Online


Add a comment
Comments
0 comments on the analysis GBP/SGD - 1H