DOW JONES - MINI DJ30 FULL0325 - Daily - Technical analysis published on 06/14/2024 (GMT)
- 140
- 0
Click here for a new analysis!
- Timeframe : Daily
- - Analysis generated on
- Status : LEVEL MAINTAINED
Summary of the analysis

Additional analysis
Quotes
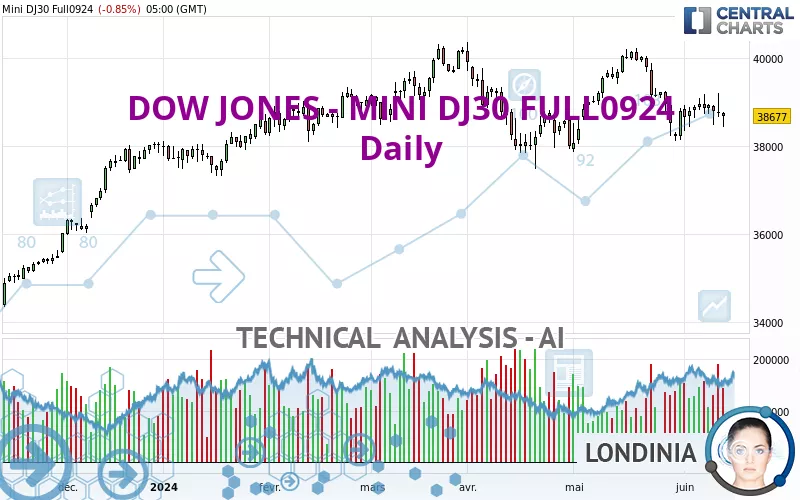
The DOW JONES - MINI DJ30 FULL0924 rating is 39,009 USD. The price has increased by +0.00% since the last closing with the lowest point at 38,701 USD and the highest point at 39,068 USD. The deviation from the price is +0.80% for the low point and -0.15% for the high point.A bearish opening was detected by the Central Gaps scanner. Sellers are trying to impose a bearish trend in the very short term.
Bearish opening
Type : Bearish
Timeframe : Openning
Here is a more detailed summary of the historical variations registered by DOW JONES - MINI DJ30 FULL0924:
Near a new HIGH record (5 years)
Type : Bullish
Timeframe : Weekly
Near a new HIGH record (1 year)
Type : Bullish
Timeframe : Weekly
Near a new HIGH record (1st january)
Type : Bullish
Timeframe : Weekly
Near a new HIGH record (1 month)
Type : Bullish
Timeframe : Weekly
Technical
Technical analysis of DOW JONES - MINI DJ30 FULL0924 in Daily shows a overall strongly bearish trend. The signals given by moving averages are 82.14% bearish. This strong bearish trend is confirmed by the strong signals currently being given by short-term moving averages. There is no crossing of moving average by the price or crossing of moving averages between themselves.
An assessment of technical indicators does not currently provide any relevant information to suggest whether the signal given by the technical indicators is more bullish or bearish.
Central Indicators, the scanner specialised in technical indicators, has identified these signals:
Parabolic SAR indicator bearish reversal
Type : Bearish
Timeframe : Daily
Ichimoku : price is under the cloud
Type : Bearish
Timeframe : Daily
Price is back under the pivot point
Type : Bearish
Timeframe : Daily
Price is back under the pivot point
Type : Bearish
Timeframe : Weekly
Momentum indicator is back over 0
Type : Bullish
Timeframe : Daily
Williams %R indicator is back under -50
Type : Bearish
Timeframe : Daily
No signals are given by Central Patterns, a market scanner specialised in chart patterns, resistances and supports.
The Central Candlesticks scanner, specialised in Japanese candlesticks, did not identify any signals.
| S3 | S2 | S1 | Price | R1 | R2 | |
|---|---|---|---|---|---|---|
| ProTrendLines | 37,195 | 38,391 | 38,937 | 39,009 | 40,022 | 40,606 |
| Change (%) | -4.65% | -1.58% | -0.18% | - | +2.60% | +4.09% |
| Change | -1,814 | -618 | -72 | - | +1,013 | +1,597 |
| Level | Major | Major | Major | - | Minor | Major |
To determine price objectives, it is also possible to use the pivot points. Here is the price position in relation to pivot points:
| Pivot points | S3 | S2 | S1 | PP | R1 | R2 | R3 |
|---|---|---|---|---|---|---|---|
| Standard | 38,551 | 38,694 | 38,885 | 39,028 | 39,219 | 39,362 | 39,553 |
| Camarilla | 38,985 | 39,016 | 39,046 | 39,077 | 39,108 | 39,138 | 39,169 |
| Woodie | 38,576 | 38,706 | 38,910 | 39,040 | 39,244 | 39,374 | 39,578 |
| Fibonacci | 38,694 | 38,821 | 38,900 | 39,028 | 39,155 | 39,234 | 39,362 |
| Pivot points | S3 | S2 | S1 | PP | R1 | R2 | R3 |
|---|---|---|---|---|---|---|---|
| Standard | 37,961 | 38,347 | 38,802 | 39,188 | 39,643 | 40,029 | 40,484 |
| Camarilla | 39,026 | 39,103 | 39,180 | 39,257 | 39,334 | 39,411 | 39,488 |
| Woodie | 37,996 | 38,364 | 38,837 | 39,205 | 39,678 | 40,046 | 40,519 |
| Fibonacci | 38,347 | 38,668 | 38,867 | 39,188 | 39,509 | 39,708 | 40,029 |
| Pivot points | S3 | S2 | S1 | PP | R1 | R2 | R3 |
|---|---|---|---|---|---|---|---|
| Standard | 36,038 | 37,238 | 38,214 | 39,414 | 40,390 | 41,590 | 42,566 |
| Camarilla | 38,593 | 38,792 | 38,992 | 39,191 | 39,390 | 39,590 | 39,789 |
| Woodie | 35,927 | 37,182 | 38,103 | 39,358 | 40,279 | 41,534 | 42,455 |
| Fibonacci | 37,238 | 38,069 | 38,582 | 39,414 | 40,245 | 40,758 | 41,590 |
Numerical data
The following is the status of the technical indicators and moving averages at the time of publication of this technical analysis:
| RSI (14): | 42.00 | |
| MACD (12,26,9): | -123.0000 | |
| Directional Movement: | -9 | |
| AROON (14): | -14 | |
| DEMA (21): | 39,165 | |
| Parabolic SAR (0,02-0,02-0,2): | 39,593 | |
| Elder Ray (13): | -343 | |
| Super Trend (3,10): | 39,773 | |
| Zig ZAG (10): | 38,982 | |
| VORTEX (21): | 1.0000 | |
| Stochastique (14,3,5): | 48.00 | |
| TEMA (21): | 39,046 | |
| Williams %R (14): | -58.00 | |
| Chande Momentum Oscillator (20): | 58 | |
| Repulse (5,40,3): | 0.0000 | |
| ROCnROLL: | 2 | |
| TRIX (15,9): | 0.0000 | |
| Courbe Coppock: | 3.00 |
| MA7: | 39,192 | |
| MA20: | 39,381 | |
| MA50: | 39,285 | |
| MA100: | 39,512 | |
| MAexp7: | 39,140 | |
| MAexp20: | 39,300 | |
| MAexp50: | 39,377 | |
| MAexp100: | 39,161 | |
| Price / MA7: | -0.47% | |
| Price / MA20: | -0.94% | |
| Price / MA50: | -0.70% | |
| Price / MA100: | -1.27% | |
| Price / MAexp7: | -0.33% | |
| Price / MAexp20: | -0.74% | |
| Price / MAexp50: | -0.93% | |
| Price / MAexp100: | -0.39% |
About author

Online


Add a comment
Comments
0 comments on the analysis DOW JONES - MINI DJ30 FULL0325 - Daily