DOW JONES - MINI DJ30 FULL0325 - Daily - Technical analysis published on 06/13/2024 (GMT)
- 152
- 0
- Timeframe : Daily
- - Analysis generated on
- Status : NEUTRAL
Summary of the analysis

Additional analysis
Quotes
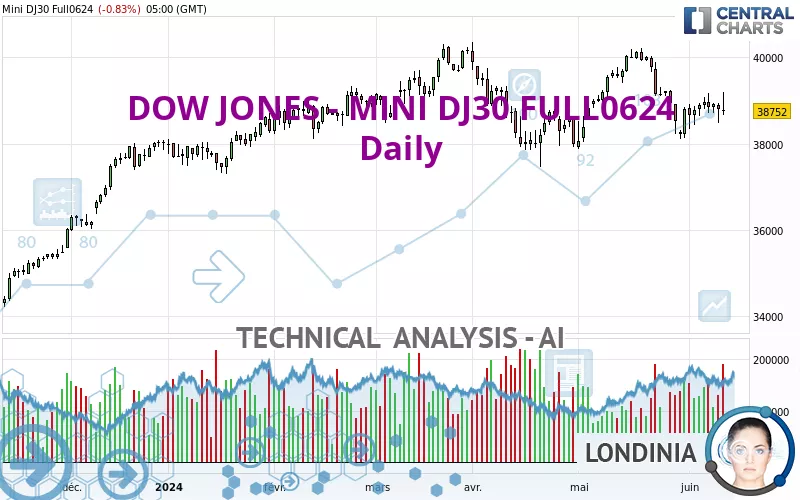
The DOW JONES - MINI DJ30 FULL0624 price is 39,037 USD. The price is lower by -0.11% since the last closing and was between 39,020 USD and 39,045 USD. This implies that the price is at +0.04% from its lowest and at -0.02% from its highest.The Central Gaps scanner detects a bullish opening marking the presence of buyers ahead of sellers at the opening but not sufficiently marked to allow the price to register a quotation gap.
Bullish opening
Type : Bullish
Timeframe : Openning
So that you have an overall view of the price change, here is a table showing the variations over several periods:
Near a new HIGH record (5 years)
Type : Bullish
Timeframe : Weekly
Near a new HIGH record (1 year)
Type : Bullish
Timeframe : Weekly
Near a new HIGH record (1st january)
Type : Bullish
Timeframe : Weekly
Near a new HIGH record (1 month)
Type : Bullish
Timeframe : Weekly
Technical
Technical analysis of DOW JONES - MINI DJ30 FULL0624 in Daily shows an overall slightly bearish trend. 50.00% of the signals given by moving averages are bullish. As the signals currently given by short-term moving averages are rather neutral, the overall trend could quickly return to neutral as well. The Central Indicators market scanner is currently detecting a bearish signal that could impact this trend:
Bearish trend reversal : adaptative moving average 100
Type : Bearish
Timeframe : Daily
An assessment of technical indicators does not currently provide any relevant information to suggest whether the signal given by the technical indicators is more bullish or bearish.
Other results related to technical indicators were also found by the Central Indicators scanner:
Ichimoku : price is over the cloud
Type : Bullish
Timeframe : Daily
Price is back under the pivot point
Type : Bearish
Timeframe : Weekly
Williams %R indicator is back under -50
Type : Bearish
Timeframe : Daily
The analysis of the price chart with Central Patterns scanners does not return any result.
The Central Candlesticks scanner, specialised in Japanese candlesticks, did not identify any signals.
| S3 | S2 | S1 | Price | R1 | R2 | |
|---|---|---|---|---|---|---|
| ProTrendLines | 36,795 | 37,991 | 38,537 | 39,037 | 39,622 | 40,206 |
| Change (%) | -5.74% | -2.68% | -1.28% | - | +1.50% | +2.99% |
| Change | -2,242 | -1,046 | -500 | - | +585 | +1,169 |
| Level | Major | Major | Major | - | Minor | Major |
To determine price objectives, it is also possible to use the pivot points. Here is the price position in relation to pivot points:
| Pivot points | S3 | S2 | S1 | PP | R1 | R2 | R3 |
|---|---|---|---|---|---|---|---|
| Standard | 38,133 | 38,285 | 38,467 | 38,619 | 38,801 | 38,953 | 39,135 |
| Camarilla | 38,558 | 38,589 | 38,619 | 38,650 | 38,681 | 38,711 | 38,742 |
| Woodie | 38,149 | 38,293 | 38,483 | 38,627 | 38,817 | 38,961 | 39,151 |
| Fibonacci | 38,285 | 38,412 | 38,491 | 38,619 | 38,746 | 38,825 | 38,953 |
| Pivot points | S3 | S2 | S1 | PP | R1 | R2 | R3 |
|---|---|---|---|---|---|---|---|
| Standard | 37,561 | 37,947 | 38,402 | 38,788 | 39,243 | 39,629 | 40,084 |
| Camarilla | 38,626 | 38,703 | 38,780 | 38,857 | 38,934 | 39,011 | 39,088 |
| Woodie | 37,596 | 37,964 | 38,437 | 38,805 | 39,278 | 39,646 | 40,119 |
| Fibonacci | 37,947 | 38,268 | 38,467 | 38,788 | 39,109 | 39,308 | 39,629 |
| Pivot points | S3 | S2 | S1 | PP | R1 | R2 | R3 |
|---|---|---|---|---|---|---|---|
| Standard | 35,638 | 36,838 | 37,814 | 39,014 | 39,990 | 41,190 | 42,166 |
| Camarilla | 38,193 | 38,392 | 38,592 | 38,791 | 38,990 | 39,190 | 39,389 |
| Woodie | 35,527 | 36,782 | 37,703 | 38,958 | 39,879 | 41,134 | 42,055 |
| Fibonacci | 36,838 | 37,669 | 38,182 | 39,014 | 39,845 | 40,358 | 41,190 |
Numerical data
The following is the status of technical indicators and moving averages registered at the time this technical analysis was created:
| RSI (14): | 43.00 | |
| MACD (12,26,9): | -111.0000 | |
| Directional Movement: | -6 | |
| AROON (14): | -29 | |
| DEMA (21): | 38,811 | |
| Parabolic SAR (0,02-0,02-0,2): | 38,307 | |
| Elder Ray (13): | -261 | |
| Super Trend (3,10): | 39,373 | |
| Zig ZAG (10): | 38,650 | |
| VORTEX (21): | 1.0000 | |
| Stochastique (14,3,5): | 47.00 | |
| TEMA (21): | 38,697 | |
| Williams %R (14): | -18.00 | |
| Chande Momentum Oscillator (20): | 506 | |
| Repulse (5,40,3): | 0.0000 | |
| ROCnROLL: | 1 | |
| TRIX (15,9): | 0.0000 | |
| Courbe Coppock: | 2.00 |
| MA7: | 38,852 | |
| MA20: | 39,058 | |
| MA50: | 38,898 | |
| MA100: | 39,112 | |
| MAexp7: | 38,845 | |
| MAexp20: | 38,931 | |
| MAexp50: | 38,992 | |
| MAexp100: | 38,764 | |
| Price / MA7: | +0.48% | |
| Price / MA20: | -0.05% | |
| Price / MA50: | +0.36% | |
| Price / MA100: | -0.19% | |
| Price / MAexp7: | +0.49% | |
| Price / MAexp20: | +0.27% | |
| Price / MAexp50: | +0.12% | |
| Price / MAexp100: | +0.70% |
About author

Online


Add a comment
Comments
0 comments on the analysis DOW JONES - MINI DJ30 FULL0325 - Daily