DOW JONES - MINI DJ30 FULL0325 - Daily - Technical analysis published on 04/10/2024 (GMT)
- 145
- 0
Click here for a new analysis!
- Timeframe : Daily
- - Analysis generated on
- Status : LEVEL MAINTAINED

Summary of the analysis

Additional analysis
Quotes
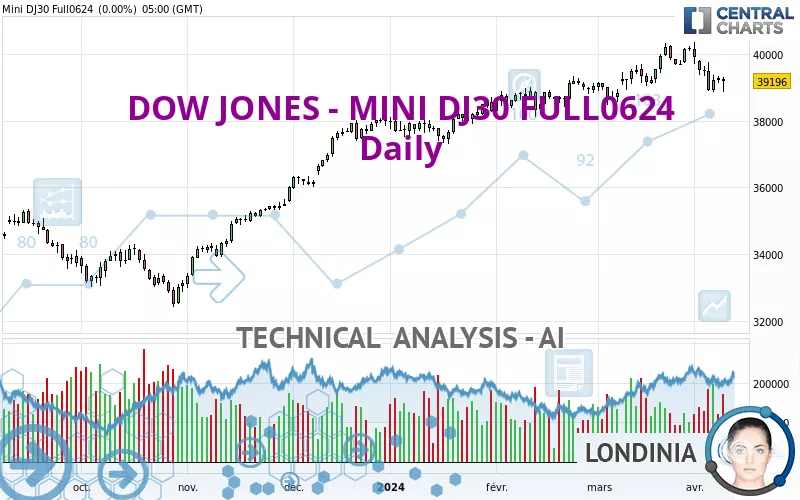
DOW JONES - MINI DJ30 FULL0624 rating 38,726 USD. On the day, this instrument lost -1.20% and was between 38,590 USD and 39,345 USD. This implies that the price is at +0.35% from its lowest and at -1.57% from its highest.The Central Gaps scanner detects a bullish opening marking the presence of buyers ahead of sellers at the opening but not sufficiently marked to allow the price to register a quotation gap.
Bullish opening
Type : Bullish
Timeframe : Openning
A study of price movements over other periods shows the following variations:
Near a new HIGH record (5 years)
Type : Bullish
Timeframe : Weekly
Near a new HIGH record (1 year)
Type : Bullish
Timeframe : Weekly
Near a new HIGH record (1st january)
Type : Bullish
Timeframe : Weekly
Near a new HIGH record (1 month)
Type : Bullish
Timeframe : Weekly
New LOW record (1 month)
Type : Bearish
Timeframe : Weekly
Technical
Technical analysis of DOW JONES - MINI DJ30 FULL0624 in Daily shows a neutral overall trend. The trend could quickly turn bearish due to the strong bearish signals currently being given by short-term moving averages. The Central Indicators scanner detects bearish signals on moving averages that could impact this trend:
Bearish trend reversal : adaptative moving average 50
Type : Bearish
Timeframe : Daily
Bearish price crossover with adaptative moving average 20
Type : Bearish
Timeframe : Daily
In fact, 12 technical indicators on 18 studied are currently bearish. Caution: the Central Indicators scanner currently detects an excess:
CCI indicator is oversold : under -100
Type : Neutral
Timeframe : Daily
Williams %R indicator is oversold : under -80
Type : Neutral
Timeframe : Daily
Pivot points : price is under support 1
Type : Neutral
Timeframe : Daily
Ichimoku : price is under the cloud
Type : Bearish
Timeframe : Daily
No signals are given by Central Patterns, a market scanner specialised in chart patterns, resistances and supports.
Central Candlesticks, the scanner specialised in Japanese candlesticks, detects a bearish signal that could support the hypothesis of a small drop in the very short term:
Three black crows
Type : Bearish
Timeframe : Daily
| S3 | S2 | S1 | Price | R1 | R2 | |
|---|---|---|---|---|---|---|
| ProTrendLines | 36,052 | 36,795 | 38,537 | 38,726 | 39,653 | 40,200 |
| Change (%) | -6.90% | -4.99% | -0.49% | - | +2.39% | +3.81% |
| Change | -2,674 | -1,931 | -189 | - | +927 | +1,474 |
| Level | Intermediate | Major | Major | - | Major | Intermediate |
Attention could also be paid to pivot points to set price objectives:
| Pivot points | S3 | S2 | S1 | PP | R1 | R2 | R3 |
|---|---|---|---|---|---|---|---|
| Standard | 38,510 | 38,691 | 38,944 | 39,125 | 39,378 | 39,559 | 39,812 |
| Camarilla | 39,077 | 39,116 | 39,156 | 39,196 | 39,236 | 39,276 | 39,315 |
| Woodie | 38,545 | 38,709 | 38,979 | 39,143 | 39,413 | 39,577 | 39,847 |
| Fibonacci | 38,691 | 38,857 | 38,960 | 39,125 | 39,291 | 39,394 | 39,559 |
| Pivot points | S3 | S2 | S1 | PP | R1 | R2 | R3 |
|---|---|---|---|---|---|---|---|
| Standard | 37,111 | 37,988 | 38,605 | 39,482 | 40,099 | 40,976 | 41,593 |
| Camarilla | 38,812 | 38,949 | 39,086 | 39,223 | 39,360 | 39,497 | 39,634 |
| Woodie | 36,982 | 37,923 | 38,476 | 39,417 | 39,970 | 40,911 | 41,464 |
| Fibonacci | 37,988 | 38,558 | 38,911 | 39,482 | 40,052 | 40,405 | 40,976 |
| Pivot points | S3 | S2 | S1 | PP | R1 | R2 | R3 |
|---|---|---|---|---|---|---|---|
| Standard | 37,634 | 38,271 | 39,083 | 39,720 | 40,532 | 41,169 | 41,981 |
| Camarilla | 39,496 | 39,628 | 39,761 | 39,894 | 40,027 | 40,160 | 40,292 |
| Woodie | 37,721 | 38,315 | 39,170 | 39,764 | 40,619 | 41,213 | 42,068 |
| Fibonacci | 38,271 | 38,825 | 39,167 | 39,720 | 40,274 | 40,616 | 41,169 |
Numerical data
The following is the status of technical indicators and moving averages registered at the time this technical analysis was created:
| RSI (14): | 38.00 | |
| MACD (12,26,9): | -66.0000 | |
| Directional Movement: | -15 | |
| AROON (14): | -50 | |
| DEMA (21): | 39,377 | |
| Parabolic SAR (0,02-0,02-0,2): | 40,040 | |
| Elder Ray (13): | -378 | |
| Super Trend (3,10): | 40,320 | |
| Zig ZAG (10): | 38,726 | |
| VORTEX (21): | 1.0000 | |
| Stochastique (14,3,5): | 18.00 | |
| TEMA (21): | 39,167 | |
| Williams %R (14): | -92.00 | |
| Chande Momentum Oscillator (20): | -1,142 | |
| Repulse (5,40,3): | -2.0000 | |
| ROCnROLL: | 2 | |
| TRIX (15,9): | 0.0000 | |
| Courbe Coppock: | 2.00 |
| MA7: | 39,181 | |
| MA20: | 39,533 | |
| MA50: | 39,348 | |
| MA100: | 38,542 | |
| MAexp7: | 39,188 | |
| MAexp20: | 39,399 | |
| MAexp50: | 39,178 | |
| MAexp100: | 38,466 | |
| Price / MA7: | -1.16% | |
| Price / MA20: | -2.04% | |
| Price / MA50: | -1.58% | |
| Price / MA100: | +0.48% | |
| Price / MAexp7: | -1.18% | |
| Price / MAexp20: | -1.71% | |
| Price / MAexp50: | -1.15% | |
| Price / MAexp100: | +0.68% |
About author

Online


Add a comment
Comments
0 comments on the analysis DOW JONES - MINI DJ30 FULL0325 - Daily