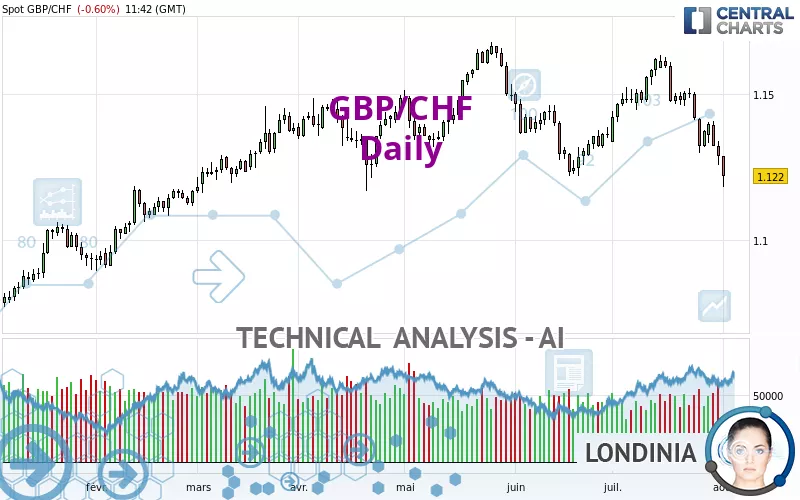
GBP/CHF - Daily - Technical analysis published on 08/01/2024 (GMT)
- 167
- 0
Click here for a new analysis!
- Timeframe : Daily
- - Analysis generated on
- Status : TARGET REACHED

Summary of the analysis

Additional analysis
Quotes
The GBP/CHF price is 1.1220 CHF. The price is lower by -0.60% since the last closing with the lowest point at 1.1181 CHF and the highest point at 1.1288 CHF. The deviation from the price is +0.35% for the low point and -0.60% for the high point.So that you have an overall view of the price change, here is a table showing the variations over several periods:
Near a new LOW record (1 year)
Type : Bearish
Timeframe : Weekly
Near a new LOW record (1st january)
Type : Bearish
Timeframe : Weekly
Near a new HIGH record (1 month)
Type : Bullish
Timeframe : Weekly
New LOW record (1 month)
Type : Bearish
Timeframe : Weekly
Technical
A technical analysis in Daily of this GBP/CHF chart shows a bearish trend. The signals given by moving averages are 75.00% bearish. This bearish trend is reinforced by the strong signals currently being given by short-term moving averages. The Central Indicators scanner does not detect any result on moving averages that would impact this trend.
In fact, according to the parameters integrated into the Central Analyzer system, 12 technical indicators out of 18 analysed are currently bearish. Caution: the Central Indicators scanner currently detects an excess:
CCI indicator is oversold : under -100
Type : Neutral
Timeframe : Daily
Williams %R indicator is oversold : under -80
Type : Neutral
Timeframe : Daily
Pivot points : price is under support 1
Type : Neutral
Timeframe : Weekly
Pivot points : price is under support 3
Type : Neutral
Timeframe : Daily
The Central Patterns scanner, which studies chart patterns, resistances and supports, has identified this signal:
Horizontal support is broken
Type : Bearish
Timeframe : Daily
The Central Candlesticks scanner, specialised in Japanese candlesticks, did not identify any signals.
| S3 | S2 | S1 | Price | R1 | R2 | R3 | |
|---|---|---|---|---|---|---|---|
| ProTrendLines | 1.0717 | 1.0914 | 1.1077 | 1.1220 | 1.1234 | 1.1345 | 1.1458 |
| Change (%) | -4.48% | -2.73% | -1.27% | - | +0.12% | +1.11% | +2.12% |
| Change | -0.0503 | -0.0306 | -0.0143 | - | +0.0014 | +0.0125 | +0.0238 |
| Level | Intermediate | Minor | Intermediate | - | Intermediate | Intermediate | Major |
Pivot points can also be used to set your price objectives. Here is the price situation in relation to pivot points:
| Pivot points | S3 | S2 | S1 | PP | R1 | R2 | R3 |
|---|---|---|---|---|---|---|---|
| Standard | 1.1169 | 1.1213 | 1.1251 | 1.1295 | 1.1333 | 1.1377 | 1.1415 |
| Camarilla | 1.1266 | 1.1273 | 1.1281 | 1.1288 | 1.1296 | 1.1303 | 1.1311 |
| Woodie | 1.1165 | 1.1212 | 1.1247 | 1.1294 | 1.1329 | 1.1376 | 1.1411 |
| Fibonacci | 1.1213 | 1.1245 | 1.1264 | 1.1295 | 1.1327 | 1.1346 | 1.1377 |
| Pivot points | S3 | S2 | S1 | PP | R1 | R2 | R3 |
|---|---|---|---|---|---|---|---|
| Standard | 1.1053 | 1.1176 | 1.1275 | 1.1398 | 1.1497 | 1.1620 | 1.1719 |
| Camarilla | 1.1313 | 1.1333 | 1.1354 | 1.1374 | 1.1394 | 1.1415 | 1.1435 |
| Woodie | 1.1041 | 1.1170 | 1.1263 | 1.1392 | 1.1485 | 1.1614 | 1.1707 |
| Fibonacci | 1.1176 | 1.1261 | 1.1313 | 1.1398 | 1.1483 | 1.1535 | 1.1620 |
| Pivot points | S3 | S2 | S1 | PP | R1 | R2 | R3 |
|---|---|---|---|---|---|---|---|
| Standard | 1.0778 | 1.1018 | 1.1153 | 1.1393 | 1.1528 | 1.1768 | 1.1903 |
| Camarilla | 1.1185 | 1.1219 | 1.1254 | 1.1288 | 1.1322 | 1.1357 | 1.1391 |
| Woodie | 1.0726 | 1.0992 | 1.1101 | 1.1367 | 1.1476 | 1.1742 | 1.1851 |
| Fibonacci | 1.1018 | 1.1161 | 1.1250 | 1.1393 | 1.1536 | 1.1625 | 1.1768 |
Numerical data
The following is the status of technical indicators and moving averages registered at the time this technical analysis was created:
| RSI (14): | 30.79 | |
| MACD (12,26,9): | -0.0042 | |
| Directional Movement: | -24.3379 | |
| AROON (14): | -92.8571 | |
| DEMA (21): | 1.1367 | |
| Parabolic SAR (0,02-0,02-0,2): | 1.1434 | |
| Elder Ray (13): | -0.0145 | |
| Super Trend (3,10): | 1.1456 | |
| Zig ZAG (10): | 1.1202 | |
| VORTEX (21): | 0.8053 | |
| Stochastique (14,3,5): | 6.88 | |
| TEMA (21): | 1.1320 | |
| Williams %R (14): | -94.03 | |
| Chande Momentum Oscillator (20): | -0.0389 | |
| Repulse (5,40,3): | -1.3755 | |
| ROCnROLL: | 2 | |
| TRIX (15,9): | -0.0044 | |
| Courbe Coppock: | 3.58 |
| MA7: | 1.1333 | |
| MA20: | 1.1460 | |
| MA50: | 1.1435 | |
| MA100: | 1.1418 | |
| MAexp7: | 1.1330 | |
| MAexp20: | 1.1405 | |
| MAexp50: | 1.1420 | |
| MAexp100: | 1.1378 | |
| Price / MA7: | -1.00% | |
| Price / MA20: | -2.09% | |
| Price / MA50: | -1.88% | |
| Price / MA100: | -1.73% | |
| Price / MAexp7: | -0.97% | |
| Price / MAexp20: | -1.62% | |
| Price / MAexp50: | -1.75% | |
| Price / MAexp100: | -1.39% |
News
The latest news and videos published on GBP/CHF at the time of the analysis were as follows:
-
 GBP/CHF Forecast July 26, 2024
-
GBP/CHF Forecast July 24, 2024
-
GBP/CHF Forecast July 18, 2024
-
GBP/CHF Forecast July 16, 2024
-
GBP/CHF Forecast July 5, 2024
About author

Online


Add a comment
Comments
0 comments on the analysis GBP/CHF - Daily