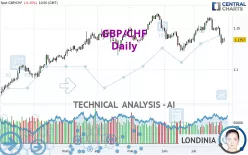
GBP/CHF - Daily - Technical analysis published on 07/29/2024 (GMT)
- 166
- 0
Click here for a new analysis!
- Timeframe : Daily
- - Analysis generated on
- Status : TARGET REACHED

Summary of the analysis

Additional analysis
Quotes
The GBP/CHF rating is 1.1358 CHF. The price is lower by -0.14% since the last closing with the lowest point at 1.1333 CHF and the highest point at 1.1384 CHF. The deviation from the price is +0.22% for the low point and -0.23% for the high point.The Central Gaps scanner detects a bearish opening marking the presence of sellers ahead of buyers at the opening but not sufficiently marked to allow the price to register a quotation gap.
Bearish opening
Type : Bearish
Timeframe : Openning
So that you have an overall view of the price change, here is a table showing the variations over several periods:
Near a new HIGH record (1 year)
Type : Bullish
Timeframe : Weekly
Near a new HIGH record (1st january)
Type : Bullish
Timeframe : Weekly
Near a new HIGH record (1 month)
Type : Bullish
Timeframe : Weekly
Technical
A technical analysis in Daily of this GBP/CHF chart shows a slightly bearish trend. Only 60.71% of the signals given by moving averages are bearish. This slightly bearish trend is reinforced by the strong signals currently being given by short-term moving averages. There is no crossing of moving average by the price or crossing of moving averages between themselves.
An assessment of technical indicators does not currently provide any relevant information on the direction of future price movements.
But beware of excesses. The Central Indicators scanner currently detects this:
CCI indicator is oversold : under -100
Type : Neutral
Timeframe : Daily
Williams %R indicator is oversold : under -80
Type : Neutral
Timeframe : Daily
Ichimoku - Bearish crossover : Tenkan & Kijun
Type : Bearish
Timeframe : Daily
Central Patterns, the market scanner focusing on chart patterns, resistances and supports found these results:
Near horizontal support
Type : Bullish
Timeframe : Daily
Near support of triangle
Type : Bullish
Timeframe : Daily
Support of channel is broken
Type : Bearish
Timeframe : Daily
From the Japanese candlestick perspective, the Central Candlesticks scanner notes the presence of these results that could impact the short-term trend:
Bearish harami
Type : Bearish
Timeframe : Daily
Doji
Type : Neutral
Timeframe : Daily
| S3 | S2 | S1 | Price | R1 | R2 | R3 | |
|---|---|---|---|---|---|---|---|
| ProTrendLines | 1.1077 | 1.1234 | 1.1345 | 1.1358 | 1.1458 | 1.1693 | 1.2155 |
| Change (%) | -2.47% | -1.09% | -0.11% | - | +0.88% | +2.95% | +7.02% |
| Change | -0.0281 | -0.0124 | -0.0013 | - | +0.0100 | +0.0335 | +0.0797 |
| Level | Intermediate | Intermediate | Intermediate | - | Major | Major | Minor |
Pivot points can also be used to set your price objectives. Here is the price situation in relation to pivot points:
| Pivot points | S3 | S2 | S1 | PP | R1 | R2 | R3 |
|---|---|---|---|---|---|---|---|
| Standard | 1.1279 | 1.1299 | 1.1337 | 1.1357 | 1.1395 | 1.1415 | 1.1453 |
| Camarilla | 1.1358 | 1.1363 | 1.1369 | 1.1374 | 1.1379 | 1.1385 | 1.1390 |
| Woodie | 1.1287 | 1.1304 | 1.1345 | 1.1362 | 1.1403 | 1.1420 | 1.1461 |
| Fibonacci | 1.1299 | 1.1322 | 1.1335 | 1.1357 | 1.1380 | 1.1393 | 1.1415 |
| Pivot points | S3 | S2 | S1 | PP | R1 | R2 | R3 |
|---|---|---|---|---|---|---|---|
| Standard | 1.1053 | 1.1176 | 1.1275 | 1.1398 | 1.1497 | 1.1620 | 1.1719 |
| Camarilla | 1.1313 | 1.1333 | 1.1354 | 1.1374 | 1.1394 | 1.1415 | 1.1435 |
| Woodie | 1.1041 | 1.1170 | 1.1263 | 1.1392 | 1.1485 | 1.1614 | 1.1707 |
| Fibonacci | 1.1176 | 1.1261 | 1.1313 | 1.1398 | 1.1483 | 1.1535 | 1.1620 |
| Pivot points | S3 | S2 | S1 | PP | R1 | R2 | R3 |
|---|---|---|---|---|---|---|---|
| Standard | 1.0930 | 1.1075 | 1.1219 | 1.1364 | 1.1508 | 1.1653 | 1.1797 |
| Camarilla | 1.1285 | 1.1311 | 1.1338 | 1.1364 | 1.1391 | 1.1417 | 1.1444 |
| Woodie | 1.0931 | 1.1075 | 1.1220 | 1.1364 | 1.1509 | 1.1653 | 1.1798 |
| Fibonacci | 1.1075 | 1.1185 | 1.1253 | 1.1364 | 1.1474 | 1.1542 | 1.1653 |
Numerical data
The following are the details of the technical indicators and moving averages that were collected to generate this technical analysis:
| RSI (14): | 40.39 | |
| MACD (12,26,9): | -0.0012 | |
| Directional Movement: | -15.5711 | |
| AROON (14): | -57.1429 | |
| DEMA (21): | 1.1445 | |
| Parabolic SAR (0,02-0,02-0,2): | 1.1510 | |
| Elder Ray (13): | -0.0083 | |
| Super Trend (3,10): | 1.1548 | |
| Zig ZAG (10): | 1.1360 | |
| VORTEX (21): | 0.9874 | |
| Stochastique (14,3,5): | 15.67 | |
| TEMA (21): | 1.1423 | |
| Williams %R (14): | -81.74 | |
| Chande Momentum Oscillator (20): | -0.0222 | |
| Repulse (5,40,3): | -0.3164 | |
| ROCnROLL: | 2 | |
| TRIX (15,9): | 0.0205 | |
| Courbe Coppock: | 1.43 |
| MA7: | 1.1422 | |
| MA20: | 1.1489 | |
| MA50: | 1.1454 | |
| MA100: | 1.1417 | |
| MAexp7: | 1.1411 | |
| MAexp20: | 1.1450 | |
| MAexp50: | 1.1438 | |
| MAexp100: | 1.1384 | |
| Price / MA7: | -0.56% | |
| Price / MA20: | -1.14% | |
| Price / MA50: | -0.84% | |
| Price / MA100: | -0.52% | |
| Price / MAexp7: | -0.46% | |
| Price / MAexp20: | -0.80% | |
| Price / MAexp50: | -0.70% | |
| Price / MAexp100: | -0.23% |
News
The latest news and videos published on GBP/CHF at the time of the analysis were as follows:
-
 GBP/CHF Forecast July 26, 2024
-
GBP/CHF Forecast July 24, 2024
-
GBP/CHF Forecast July 18, 2024
-
GBP/CHF Forecast July 16, 2024
-
GBP/CHF Forecast July 5, 2024
About author

Online


Add a comment
Comments
0 comments on the analysis GBP/CHF - Daily