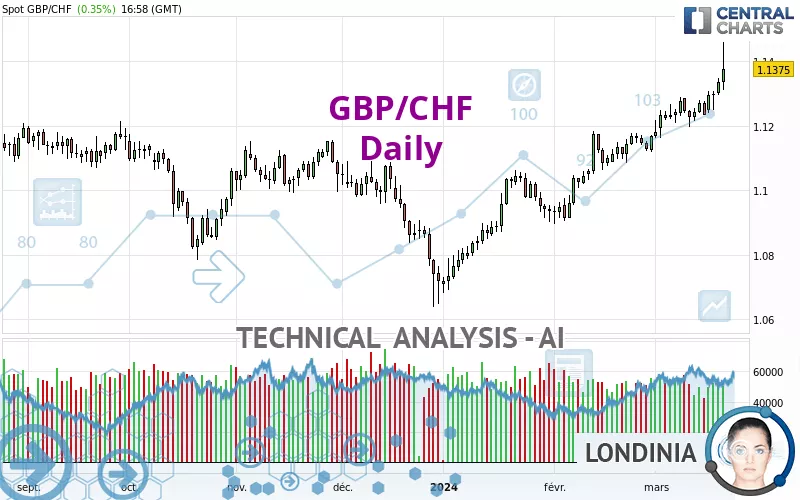
GBP/CHF - Daily - Technical analysis published on 03/21/2024 (GMT)
- 209
- 0
Click here for a new analysis!
- Timeframe : Daily
- - Analysis generated on
- Status : TARGET REACHED
Summary of the analysis

Additional analysis
Quotes
The GBP/CHF price is 1.1375 CHF. On the day, this instrument gained +0.35% and was between 1.1311 CHF and 1.1460 CHF. This implies that the price is at +0.57% from its lowest and at -0.74% from its highest.So that you have an overall view of the price change, here is a table showing the variations over several periods:
Near a new HIGH record (1 year)
Type : Bullish
Timeframe : Weekly
New HIGH record (1st january)
Type : Bullish
Timeframe : Weekly
New HIGH record (1 month)
Type : Bullish
Timeframe : Weekly
Technical
A technical analysis in Daily of this GBP/CHF chart shows a strongly bullish trend. The signals given by the moving averages are 92.86% bullish. This strong bullish trend is confirmed by the strong signals currently being given by short-term moving averages. There is no crossing of moving average by the price or crossing of moving averages between themselves.
An assessment of technical indicators shows a strong bullish signal.
But beware of excesses. The Central Indicators scanner currently detects this:
RSI indicator is overbought : over 70
Type : Neutral
Timeframe : Daily
CCI indicator is overbought : over 100
Type : Neutral
Timeframe : Daily
Pivot points : price is over resistance 1
Type : Neutral
Timeframe : Daily
Pivot points : price is over resistance 3
Type : Neutral
Timeframe : Weekly
Central Patterns, the market scanner focusing on chart patterns, resistances and supports found these results:
Near resistance of channel
Type : Bearish
Timeframe : Daily
Horizontal resistance is broken
Type : Bullish
Timeframe : Daily
The Central Candlesticks scanner, specialised in Japanese candlesticks, did not identify any signals.
| S3 | S2 | S1 | Price | R1 | R2 | R3 | |
|---|---|---|---|---|---|---|---|
| ProTrendLines | 1.0914 | 1.1077 | 1.1336 | 1.1375 | 1.1458 | 1.1693 | 1.2183 |
| Change (%) | -4.05% | -2.62% | -0.34% | - | +0.73% | +2.80% | +7.10% |
| Change | -0.0461 | -0.0298 | -0.0039 | - | +0.0083 | +0.0318 | +0.0808 |
| Level | Minor | Intermediate | Minor | - | Major | Minor | Minor |
To determine price objectives, it is also possible to use the pivot points. Here is the price position in relation to pivot points:
| Pivot points | S3 | S2 | S1 | PP | R1 | R2 | R3 |
|---|---|---|---|---|---|---|---|
| Standard | 1.1251 | 1.1273 | 1.1304 | 1.1326 | 1.1357 | 1.1379 | 1.1410 |
| Camarilla | 1.1320 | 1.1325 | 1.1330 | 1.1335 | 1.1340 | 1.1345 | 1.1350 |
| Woodie | 1.1256 | 1.1275 | 1.1309 | 1.1328 | 1.1362 | 1.1381 | 1.1415 |
| Fibonacci | 1.1273 | 1.1293 | 1.1306 | 1.1326 | 1.1346 | 1.1359 | 1.1379 |
| Pivot points | S3 | S2 | S1 | PP | R1 | R2 | R3 |
|---|---|---|---|---|---|---|---|
| Standard | 1.1102 | 1.1149 | 1.1192 | 1.1239 | 1.1282 | 1.1329 | 1.1372 |
| Camarilla | 1.1209 | 1.1218 | 1.1226 | 1.1234 | 1.1242 | 1.1251 | 1.1259 |
| Woodie | 1.1099 | 1.1148 | 1.1189 | 1.1238 | 1.1279 | 1.1328 | 1.1369 |
| Fibonacci | 1.1149 | 1.1184 | 1.1205 | 1.1239 | 1.1274 | 1.1295 | 1.1329 |
| Pivot points | S3 | S2 | S1 | PP | R1 | R2 | R3 |
|---|---|---|---|---|---|---|---|
| Standard | 1.0690 | 1.0793 | 1.0980 | 1.1083 | 1.1270 | 1.1373 | 1.1560 |
| Camarilla | 1.1088 | 1.1115 | 1.1141 | 1.1168 | 1.1195 | 1.1221 | 1.1248 |
| Woodie | 1.0733 | 1.0814 | 1.1023 | 1.1104 | 1.1313 | 1.1394 | 1.1603 |
| Fibonacci | 1.0793 | 1.0903 | 1.0972 | 1.1083 | 1.1193 | 1.1262 | 1.1373 |
Numerical data
The following is the status of the technical indicators and moving averages at the time of publication of this technical analysis:
| RSI (14): | 73.06 | |
| MACD (12,26,9): | 0.0065 | |
| Directional Movement: | 30.1235 | |
| AROON (14): | 100.0000 | |
| DEMA (21): | 1.1324 | |
| Parabolic SAR (0,02-0,02-0,2): | 1.1207 | |
| Elder Ray (13): | 0.0114 | |
| Super Trend (3,10): | 1.1201 | |
| Zig ZAG (10): | 1.1379 | |
| VORTEX (21): | 1.1833 | |
| Stochastique (14,3,5): | 87.15 | |
| TEMA (21): | 1.1340 | |
| Williams %R (14): | -27.42 | |
| Chande Momentum Oscillator (20): | 0.0154 | |
| Repulse (5,40,3): | 0.6685 | |
| ROCnROLL: | 1 | |
| TRIX (15,9): | 0.0786 | |
| Courbe Coppock: | 2.24 |
| MA7: | 1.1294 | |
| MA20: | 1.1235 | |
| MA50: | 1.1103 | |
| MA100: | 1.1041 | |
| MAexp7: | 1.1307 | |
| MAexp20: | 1.1238 | |
| MAexp50: | 1.1140 | |
| MAexp100: | 1.1092 | |
| Price / MA7: | +0.72% | |
| Price / MA20: | +1.25% | |
| Price / MA50: | +2.45% | |
| Price / MA100: | +3.03% | |
| Price / MAexp7: | +0.60% | |
| Price / MAexp20: | +1.22% | |
| Price / MAexp50: | +2.11% | |
| Price / MAexp100: | +2.55% |
News
The last news published on GBP/CHF at the time of the generation of this analysis was as follows:
-
 GBP/CHF Forecast March 22, 2024
-
GBP/CHF Forecast December 14, 2023
-
GBP/CHF Forecast December24, 2021
-
Weekly Technical Analysis: 23/07/2019 - USDJPY, GBPCHF, NZDUSD
-
GBP/CHF Is a Preferred Setup Because of its Lack of Key Events (Quick Take Video)
About author

Online


Add a comment
Comments
0 comments on the analysis GBP/CHF - Daily