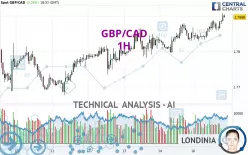
GBP/CAD - 1H - Technical analysis published on 02/17/2025 (GMT)
- 389
- 0
Click here for a new analysis!
- Timeframe : 1H
- - Analysis generated on
- Status : TARGET REACHED

Summary of the analysis

Additional analysis
Quotes
The GBP/CAD rating is 1.7898 CAD. The price has increased by +0.26% since the last closing and was traded between 1.7830 CAD and 1.7909 CAD over the period. The price is currently at +0.38% from its lowest and -0.06% from its highest.So that you have an overall view of the price change, here is a table showing the variations over several periods:
Near a new HIGH record (5 years)
Type : Bullish
Timeframe : Weekly
Near a new HIGH record (1 year)
Type : Bullish
Timeframe : Weekly
Near a new LOW record (1st january)
Type : Bearish
Timeframe : Weekly
Technical
Technical analysis of this 1H chart of GBP/CAD indicates that the overall trend is strongly bullish. The signals given by the moving averages are 92.86% bullish. This strong bullish trend is confirmed by the strong signals currently being given by short-term moving averages. The Central Indicators market scanner currently does not detect any result that concerns moving averages.
In fact, 15 technical indicators on 18 studied are currently positioned bullish. Caution: the Central Indicators scanner currently detects an excess:
CCI indicator is overbought : over 100
Type : Neutral
Timeframe : 1 hour
Williams %R indicator is overbought : over -20
Type : Neutral
Timeframe : 1 hour
The Central Patterns scanner, which studies chart patterns, resistances and supports, has identified this signal:
Near resistance of channel
Type : Bearish
Timeframe : 1 hour
No result was found by the Central Candlesticks scanner on Japanese candlesticks.
| S3 | S2 | S1 | Price | R1 | R2 | R3 | |
|---|---|---|---|---|---|---|---|
| ProTrendLines | 1.7767 | 1.7796 | 1.7870 | 1.7898 | 1.7922 | 1.8029 | 1.8101 |
| Change (%) | -0.73% | -0.57% | -0.16% | - | +0.13% | +0.73% | +1.13% |
| Change | -0.0131 | -0.0102 | -0.0028 | - | +0.0024 | +0.0131 | +0.0203 |
| Level | Major | Intermediate | Intermediate | - | Minor | Intermediate | Intermediate |
Attention could also be paid to pivot points to set price objectives:
| Pivot points | S3 | S2 | S1 | PP | R1 | R2 | R3 |
|---|---|---|---|---|---|---|---|
| Standard | 1.7720 | 1.7758 | 1.7805 | 1.7843 | 1.7890 | 1.7928 | 1.7975 |
| Camarilla | 1.7829 | 1.7836 | 1.7844 | 1.7852 | 1.7860 | 1.7868 | 1.7875 |
| Woodie | 1.7725 | 1.7760 | 1.7810 | 1.7845 | 1.7895 | 1.7930 | 1.7980 |
| Fibonacci | 1.7758 | 1.7791 | 1.7811 | 1.7843 | 1.7876 | 1.7896 | 1.7928 |
| Pivot points | S3 | S2 | S1 | PP | R1 | R2 | R3 |
|---|---|---|---|---|---|---|---|
| Standard | 1.7520 | 1.7598 | 1.7725 | 1.7803 | 1.7930 | 1.8008 | 1.8135 |
| Camarilla | 1.7796 | 1.7814 | 1.7833 | 1.7852 | 1.7871 | 1.7890 | 1.7908 |
| Woodie | 1.7545 | 1.7610 | 1.7750 | 1.7815 | 1.7955 | 1.8020 | 1.8160 |
| Fibonacci | 1.7598 | 1.7676 | 1.7725 | 1.7803 | 1.7881 | 1.7930 | 1.8008 |
| Pivot points | S3 | S2 | S1 | PP | R1 | R2 | R3 |
|---|---|---|---|---|---|---|---|
| Standard | 1.6943 | 1.7201 | 1.7613 | 1.7871 | 1.8283 | 1.8541 | 1.8953 |
| Camarilla | 1.7842 | 1.7903 | 1.7965 | 1.8026 | 1.8087 | 1.8149 | 1.8210 |
| Woodie | 1.7021 | 1.7240 | 1.7691 | 1.7910 | 1.8361 | 1.8580 | 1.9031 |
| Fibonacci | 1.7201 | 1.7457 | 1.7615 | 1.7871 | 1.8127 | 1.8285 | 1.8541 |
Numerical data
The following is the status of the technical indicators and moving averages at the time of publication of this technical analysis:
| RSI (14): | 69.43 | |
| MACD (12,26,9): | 0.0014 | |
| Directional Movement: | 20.3713 | |
| AROON (14): | 85.7142 | |
| DEMA (21): | 1.7887 | |
| Parabolic SAR (0,02-0,02-0,2): | 1.7868 | |
| Elder Ray (13): | 0.0024 | |
| Super Trend (3,10): | 1.7849 | |
| Zig ZAG (10): | 1.7899 | |
| VORTEX (21): | 1.1486 | |
| Stochastique (14,3,5): | 90.91 | |
| TEMA (21): | 1.7892 | |
| Williams %R (14): | -14.47 | |
| Chande Momentum Oscillator (20): | 0.0043 | |
| Repulse (5,40,3): | 0.0933 | |
| ROCnROLL: | 1 | |
| TRIX (15,9): | 0.0080 | |
| Courbe Coppock: | 0.44 |
| MA7: | 1.7803 | |
| MA20: | 1.7851 | |
| MA50: | 1.7884 | |
| MA100: | 1.7885 | |
| MAexp7: | 1.7886 | |
| MAexp20: | 1.7870 | |
| MAexp50: | 1.7850 | |
| MAexp100: | 1.7833 | |
| Price / MA7: | +0.53% | |
| Price / MA20: | +0.26% | |
| Price / MA50: | +0.08% | |
| Price / MA100: | +0.07% | |
| Price / MAexp7: | +0.07% | |
| Price / MAexp20: | +0.16% | |
| Price / MAexp50: | +0.27% | |
| Price / MAexp100: | +0.36% |
News
Don't forget to follow the news on GBP/CAD. At the time of publication of this analysis, the latest news was as follows:
-
 GBP/CAD Forecast November 21, 2024
-
GBP/CAD Forecast October 14, 2024
-
GBP/CAD Forecast September 2, 2024
-
GBP/CAD Forecast August 29, 2024
-
GBP/CAD Forecast August 13, 2024
About author

Online


Add a comment
Comments
0 comments on the analysis GBP/CAD - 1H