GBP/CAD - 1H - Technical analysis published on 01/06/2025 (GMT)
- 192
- 0
Click here for a new analysis!
- Timeframe : 1H
- - Analysis generated on
- Status : INVALID

Summary of the analysis

Additional analysis
Quotes
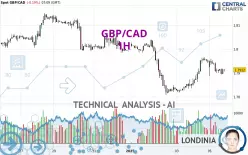
GBP/CAD rating 1.7912 CAD. The price registered a decrease of -0.19% on the session and was traded between 1.7885 CAD and 1.7958 CAD over the period. The price is currently at +0.15% from its lowest and -0.26% from its highest.The Central Gaps scanner detects a bearish opening. A small advantage for sellers in the very short term.
Bearish opening
Type : Bearish
Timeframe : Openning
A study of price movements over other periods shows the following variations:
Near a new HIGH record (5 years)
Type : Bullish
Timeframe : Weekly
Near a new HIGH record (1 year)
Type : Bullish
Timeframe : Weekly
Near a new HIGH record (1st january)
Type : Bullish
Timeframe : Weekly
Near a new HIGH record (1 month)
Type : Bullish
Timeframe : Weekly
Technical
Technical analysis of GBP/CAD in 1H shows an overall bearish trend. 78.57% of the signals given by moving averages are bearish. Caution: the neutral signals currently given by short-term moving averages show us that the global trend is losing momentum. The Central Indicators scanner detects a bullish signal on moving averages that could impact this trend:
Bullish price crossover with Moving Average 50
Type : Bullish
Timeframe : 1 hour
The probability of a further decline is low given the direction of the technical indicators.
The Central Indicators scanner specialised in technical indicators, has not detected anything further.
No signals are given by Central Patterns, a market scanner specialised in chart patterns, resistances and supports.
The Central Candlesticks scanner which studies Japanese candlesticks did not detect anything.
| S3 | S2 | S1 | Price | R1 | R2 | R3 | |
|---|---|---|---|---|---|---|---|
| ProTrendLines | 1.7767 | 1.7806 | 1.7864 | 1.7912 | 1.7967 | 1.8004 | 1.8059 |
| Change (%) | -0.81% | -0.59% | -0.27% | - | +0.31% | +0.51% | +0.82% |
| Change | -0.0145 | -0.0106 | -0.0048 | - | +0.0055 | +0.0092 | +0.0147 |
| Level | Intermediate | Major | Major | - | Minor | Intermediate | Minor |
Pivot points can also be used to set your price objectives. Here is the price situation in relation to pivot points:
| Pivot points | S3 | S2 | S1 | PP | R1 | R2 | R3 |
|---|---|---|---|---|---|---|---|
| Standard | 1.7707 | 1.7763 | 1.7854 | 1.7910 | 1.8001 | 1.8057 | 1.8148 |
| Camarilla | 1.7906 | 1.7919 | 1.7933 | 1.7946 | 1.7960 | 1.7973 | 1.7986 |
| Woodie | 1.7726 | 1.7772 | 1.7873 | 1.7919 | 1.8020 | 1.8066 | 1.8167 |
| Fibonacci | 1.7763 | 1.7819 | 1.7854 | 1.7910 | 1.7966 | 1.8001 | 1.8057 |
| Pivot points | S3 | S2 | S1 | PP | R1 | R2 | R3 |
|---|---|---|---|---|---|---|---|
| Standard | 1.7453 | 1.7629 | 1.7788 | 1.7964 | 1.8123 | 1.8299 | 1.8458 |
| Camarilla | 1.7854 | 1.7885 | 1.7915 | 1.7946 | 1.7977 | 1.8007 | 1.8038 |
| Woodie | 1.7444 | 1.7625 | 1.7779 | 1.7960 | 1.8114 | 1.8295 | 1.8449 |
| Fibonacci | 1.7629 | 1.7757 | 1.7836 | 1.7964 | 1.8092 | 1.8171 | 1.8299 |
| Pivot points | S3 | S2 | S1 | PP | R1 | R2 | R3 |
|---|---|---|---|---|---|---|---|
| Standard | 1.7263 | 1.7506 | 1.7748 | 1.7991 | 1.8233 | 1.8476 | 1.8718 |
| Camarilla | 1.7858 | 1.7902 | 1.7947 | 1.7991 | 1.8036 | 1.8080 | 1.8124 |
| Woodie | 1.7264 | 1.7506 | 1.7749 | 1.7991 | 1.8234 | 1.8476 | 1.8719 |
| Fibonacci | 1.7506 | 1.7691 | 1.7805 | 1.7991 | 1.8176 | 1.8290 | 1.8476 |
Numerical data
The following is the status of technical indicators and moving averages registered at the time this technical analysis was created:
| RSI (14): | 50.52 | |
| MACD (12,26,9): | 0.0005 | |
| Directional Movement: | -12.2878 | |
| AROON (14): | -21.4286 | |
| DEMA (21): | 1.7921 | |
| Parabolic SAR (0,02-0,02-0,2): | 1.7952 | |
| Elder Ray (13): | -0.0011 | |
| Super Trend (3,10): | 1.7891 | |
| Zig ZAG (10): | 1.7909 | |
| VORTEX (21): | 1.1187 | |
| Stochastique (14,3,5): | 28.33 | |
| TEMA (21): | 1.7929 | |
| Williams %R (14): | -65.00 | |
| Chande Momentum Oscillator (20): | -0.0042 | |
| Repulse (5,40,3): | 0.0390 | |
| ROCnROLL: | 2 | |
| TRIX (15,9): | 0.0101 | |
| Courbe Coppock: | 0.06 |
| MA7: | 1.7981 | |
| MA20: | 1.8032 | |
| MA50: | 1.7925 | |
| MA100: | 1.7902 | |
| MAexp7: | 1.7914 | |
| MAexp20: | 1.7913 | |
| MAexp50: | 1.7917 | |
| MAexp100: | 1.7946 | |
| Price / MA7: | -0.38% | |
| Price / MA20: | -0.67% | |
| Price / MA50: | -0.07% | |
| Price / MA100: | +0.06% | |
| Price / MAexp7: | -0.01% | |
| Price / MAexp20: | -0.01% | |
| Price / MAexp50: | -0.03% | |
| Price / MAexp100: | -0.19% |
News
The last news published on GBP/CAD at the time of the generation of this analysis was as follows:
-
 GBP/CAD Forecast November 21, 2024
-
GBP/CAD Forecast October 14, 2024
-
GBP/CAD Forecast September 2, 2024
-
GBP/CAD Forecast August 29, 2024
-
GBP/CAD Forecast August 13, 2024
About author

Online


Add a comment
Comments
0 comments on the analysis GBP/CAD - 1H