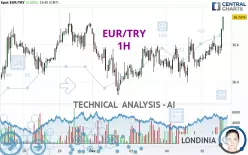
EUR/TRY - 1H - Technical analysis published on 12/05/2024 (GMT)
- 114
- 0
Click here for a new analysis!
- Timeframe : 1H
- - Analysis generated on
- Status : INVALID

Summary of the analysis

Additional analysis
Quotes
EUR/TRY rating 36.7476 TRY. The price has increased by +0.60% since the last closing and was traded between 36.5135 TRY and 36.7530 TRY over the period. The price is currently at +0.64% from its lowest and -0.01% from its highest.The Central Gaps scanner detects a bearish opening. A small advantage for sellers in the very short term.
Bearish opening
Type : Bearish
Timeframe : Openning
Here is a more detailed summary of the historical variations registered by EUR/TRY:
Near a new HIGH record (1 month)
Type : Bullish
Timeframe : Weekly
Technical
Technical analysis of this 1H chart of EUR/TRY indicates that the overall trend is strongly bullish. The signals given by the moving averages are 92.86% bullish. This strong bullish trend is confirmed by the strong signals currently being given by short-term moving averages. The Central Indicators market scanner is currently detecting several bullish signals that could impact this trend:
Bullish trend reversal : Moving Average 100
Type : Bullish
Timeframe : 1 hour
Moving Average bullish crossovers : AMA20 & AMA50
Type : Bullish
Timeframe : 1 hour
The probability of a further increase is high given the direction of the technical indicators.
But beware of excesses. The Central Indicators scanner currently detects this:
CCI indicator is overbought : over 100
Type : Neutral
Timeframe : 1 hour
Previous candle closed over Bollinger bands
Type : Neutral
Timeframe : 1 hour
Williams %R indicator is overbought : over -20
Type : Neutral
Timeframe : 1 hour
Pivot points : price is over resistance 1
Type : Neutral
Timeframe : 1 hour
Central Patterns, the market scanner focusing on chart patterns, resistances and supports found these results:
Near horizontal resistance
Type : Bearish
Timeframe : 1 hour
Near resistance of triangle
Type : Bearish
Timeframe : 1 hour
Central Candlesticks, the scanner specialised in Japanese candlesticks, detects this inversion signal that could impact the current short-term trend:
Doji
Type : Neutral
Timeframe : 1 hour
| S3 | S2 | S1 | Price | R1 | R2 | R3 | |
|---|---|---|---|---|---|---|---|
| ProTrendLines | 36.5279 | 36.6343 | 36.6963 | 36.7476 | 36.7698 | 36.9441 | 37.5024 |
| Change (%) | -0.60% | -0.31% | -0.14% | - | +0.06% | +0.53% | +2.05% |
| Change | -0.2197 | -0.1133 | -0.0513 | - | +0.0222 | +0.1965 | +0.7548 |
| Level | Minor | Intermediate | Minor | - | Minor | Minor | Major |
Pivot points can also be used to set your price objectives. Here is the price situation in relation to pivot points:
| Pivot points | S3 | S2 | S1 | PP | R1 | R2 | R3 |
|---|---|---|---|---|---|---|---|
| Standard | 36.1578 | 36.2768 | 36.4025 | 36.5215 | 36.6472 | 36.7662 | 36.8919 |
| Camarilla | 36.4609 | 36.4833 | 36.5058 | 36.5282 | 36.5506 | 36.5731 | 36.5955 |
| Woodie | 36.1612 | 36.2785 | 36.4059 | 36.5232 | 36.6506 | 36.7679 | 36.8953 |
| Fibonacci | 36.2768 | 36.3703 | 36.4280 | 36.5215 | 36.6150 | 36.6727 | 36.7662 |
| Pivot points | S3 | S2 | S1 | PP | R1 | R2 | R3 |
|---|---|---|---|---|---|---|---|
| Standard | 35.5816 | 35.8335 | 36.2660 | 36.5179 | 36.9504 | 37.2023 | 37.6348 |
| Camarilla | 36.5103 | 36.5730 | 36.6358 | 36.6985 | 36.7612 | 36.8240 | 36.8867 |
| Woodie | 35.6719 | 35.8787 | 36.3563 | 36.5631 | 37.0407 | 37.2475 | 37.7251 |
| Fibonacci | 35.8335 | 36.0949 | 36.2565 | 36.5179 | 36.7793 | 36.9409 | 37.2023 |
| Pivot points | S3 | S2 | S1 | PP | R1 | R2 | R3 |
|---|---|---|---|---|---|---|---|
| Standard | 33.9794 | 34.8571 | 35.7778 | 36.6555 | 37.5762 | 38.4539 | 39.3746 |
| Camarilla | 36.2039 | 36.3688 | 36.5337 | 36.6985 | 36.8634 | 37.0282 | 37.1931 |
| Woodie | 34.0009 | 34.8679 | 35.7993 | 36.6663 | 37.5977 | 38.4647 | 39.3961 |
| Fibonacci | 34.8571 | 35.5441 | 35.9685 | 36.6555 | 37.3425 | 37.7669 | 38.4539 |
Numerical data
The following is the status of technical indicators and moving averages registered at the time this technical analysis was created:
| RSI (14): | 71.69 | |
| MACD (12,26,9): | 0.0353 | |
| Directional Movement: | 20.4286 | |
| AROON (14): | 100.0000 | |
| DEMA (21): | 36.6290 | |
| Parabolic SAR (0,02-0,02-0,2): | 36.5092 | |
| Elder Ray (13): | 0.1055 | |
| Super Trend (3,10): | 36.5326 | |
| Zig ZAG (10): | 36.7369 | |
| VORTEX (21): | 1.0997 | |
| Stochastique (14,3,5): | 82.27 | |
| TEMA (21): | 36.6538 | |
| Williams %R (14): | -2.17 | |
| Chande Momentum Oscillator (20): | 0.1924 | |
| Repulse (5,40,3): | 0.5175 | |
| ROCnROLL: | 1 | |
| TRIX (15,9): | 0.0083 | |
| Courbe Coppock: | 0.52 |
| MA7: | 36.5956 | |
| MA20: | 36.4609 | |
| MA50: | 36.9960 | |
| MA100: | 37.0820 | |
| MAexp7: | 36.6370 | |
| MAexp20: | 36.5869 | |
| MAexp50: | 36.5512 | |
| MAexp100: | 36.5272 | |
| Price / MA7: | +0.42% | |
| Price / MA20: | +0.79% | |
| Price / MA50: | -0.67% | |
| Price / MA100: | -0.90% | |
| Price / MAexp7: | +0.30% | |
| Price / MAexp20: | +0.44% | |
| Price / MAexp50: | +0.54% | |
| Price / MAexp100: | +0.60% |
News
The latest news and videos published on EUR/TRY at the time of the analysis were as follows:
About author
Online


Add a comment
Comments
0 comments on the analysis EUR/TRY - 1H