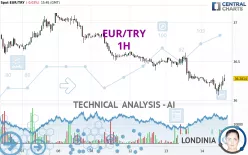
EUR/TRY - 1H - Technical analysis published on 11/14/2024 (GMT)
- 126
- 0
Click here for a new analysis!
- Timeframe : 1H
- - Analysis generated on
- Status : TARGET REACHED

Summary of the analysis

Additional analysis
Quotes
EUR/TRY rating 36.2822 TRY. On the day, this instrument lost -0.02% and was traded between 36.0643 TRY and 36.3297 TRY over the period. The price is currently at +0.60% from its lowest and -0.13% from its highest.The Central Gaps scanner detects a bullish opening. A small advantage for buyers in the very short term.
Bullish opening
Type : Bullish
Timeframe : Openning
Here is a more detailed summary of the historical variations registered by EUR/TRY:
Near a new HIGH record (1 month)
Type : Bullish
Timeframe : Weekly
New LOW record (1 month)
Type : Bearish
Timeframe : Weekly
Technical
A technical analysis in 1H of this EUR/TRY chart shows a bearish trend. The signals given by moving averages are 75.00% bearish. This bearish trend could slow down given the neutral signals currently being given by short-term moving averages. The Central Indicators market scanner is currently detecting several bullish signals that could impact this trend:
Bullish trend reversal : adaptative moving average 20
Type : Bullish
Timeframe : 1 hour
Bullish price crossover with adaptative moving average 100
Type : Bullish
Timeframe : 1 hour
An assessment of technical indicators shows a moderate bullish signal.
Caution: the Central Indicators scanner currently detects an excess:
CCI indicator is overbought : over 100
Type : Neutral
Timeframe : 1 hour
Pivot points : price is under support 1
Type : Neutral
Timeframe : Weekly
Central Patterns, the scanner specializing in chart patterns, did not identify any signals.
Central Candlesticks, the scanner specialised in Japanese candlesticks, detects this inversion signal that could impact the current short-term trend:
White gravestone / inverted hammer
Type : Neutral
Timeframe : 1 hour
| S3 | S2 | S1 | Price | R1 | R2 | R3 | |
|---|---|---|---|---|---|---|---|
| ProTrendLines | 35.0272 | 35.4486 | 36.2006 | 36.2822 | 36.3818 | 36.6321 | 36.9441 |
| Change (%) | -3.46% | -2.30% | -0.22% | - | +0.27% | +0.96% | +1.82% |
| Change | -1.2550 | -0.8336 | -0.0816 | - | +0.0996 | +0.3499 | +0.6619 |
| Level | Intermediate | Major | Intermediate | - | Minor | Intermediate | Intermediate |
To determine price objectives, it is also possible to use the pivot points. Here is the price position in relation to pivot points:
| Pivot points | S3 | S2 | S1 | PP | R1 | R2 | R3 |
|---|---|---|---|---|---|---|---|
| Standard | 35.7915 | 36.0192 | 36.1548 | 36.3825 | 36.5181 | 36.7458 | 36.8814 |
| Camarilla | 36.1906 | 36.2239 | 36.2572 | 36.2905 | 36.3238 | 36.3571 | 36.3904 |
| Woodie | 35.7456 | 35.9962 | 36.1089 | 36.3595 | 36.4722 | 36.7228 | 36.8355 |
| Fibonacci | 36.0192 | 36.1580 | 36.2437 | 36.3825 | 36.5213 | 36.6070 | 36.7458 |
| Pivot points | S3 | S2 | S1 | PP | R1 | R2 | R3 |
|---|---|---|---|---|---|---|---|
| Standard | 35.4986 | 36.0437 | 36.4429 | 36.9880 | 37.3872 | 37.9323 | 38.3315 |
| Camarilla | 36.5823 | 36.6689 | 36.7554 | 36.8420 | 36.9286 | 37.0151 | 37.1017 |
| Woodie | 35.4256 | 36.0072 | 36.3699 | 36.9515 | 37.3142 | 37.8958 | 38.2585 |
| Fibonacci | 36.0437 | 36.4045 | 36.6273 | 36.9880 | 37.3488 | 37.5716 | 37.9323 |
| Pivot points | S3 | S2 | S1 | PP | R1 | R2 | R3 |
|---|---|---|---|---|---|---|---|
| Standard | 35.5531 | 36.2186 | 36.7780 | 37.4435 | 38.0029 | 38.6684 | 39.2278 |
| Camarilla | 37.0007 | 37.1129 | 37.2252 | 37.3375 | 37.4498 | 37.5621 | 37.6744 |
| Woodie | 35.5002 | 36.1921 | 36.7251 | 37.4170 | 37.9500 | 38.6419 | 39.1749 |
| Fibonacci | 36.2186 | 36.6865 | 36.9756 | 37.4435 | 37.9114 | 38.2005 | 38.6684 |
Numerical data
The following is the status of the technical indicators and moving averages at the time of publication of this technical analysis:
| RSI (14): | 50.10 | |
| MACD (12,26,9): | -0.0459 | |
| Directional Movement: | 1.4332 | |
| AROON (14): | 28.5714 | |
| DEMA (21): | 36.1794 | |
| Parabolic SAR (0,02-0,02-0,2): | 36.0854 | |
| Elder Ray (13): | 0.0604 | |
| Super Trend (3,10): | 36.2934 | |
| Zig ZAG (10): | 36.2674 | |
| VORTEX (21): | 0.9767 | |
| Stochastique (14,3,5): | 68.22 | |
| TEMA (21): | 36.1859 | |
| Williams %R (14): | -22.04 | |
| Chande Momentum Oscillator (20): | 0.0468 | |
| Repulse (5,40,3): | 0.0932 | |
| ROCnROLL: | -1 | |
| TRIX (15,9): | -0.0244 | |
| Courbe Coppock: | 0.36 |
| MA7: | 36.6144 | |
| MA20: | 36.9689 | |
| MA50: | 37.4143 | |
| MA100: | 36.9532 | |
| MAexp7: | 36.2204 | |
| MAexp20: | 36.2472 | |
| MAexp50: | 36.3543 | |
| MAexp100: | 36.5044 | |
| Price / MA7: | -0.91% | |
| Price / MA20: | -1.86% | |
| Price / MA50: | -3.03% | |
| Price / MA100: | -1.82% | |
| Price / MAexp7: | +0.17% | |
| Price / MAexp20: | +0.10% | |
| Price / MAexp50: | -0.20% | |
| Price / MAexp100: | -0.61% |
News
The latest news and videos published on EUR/TRY at the time of the analysis were as follows:
About author
Online


Add a comment
Comments
0 comments on the analysis EUR/TRY - 1H