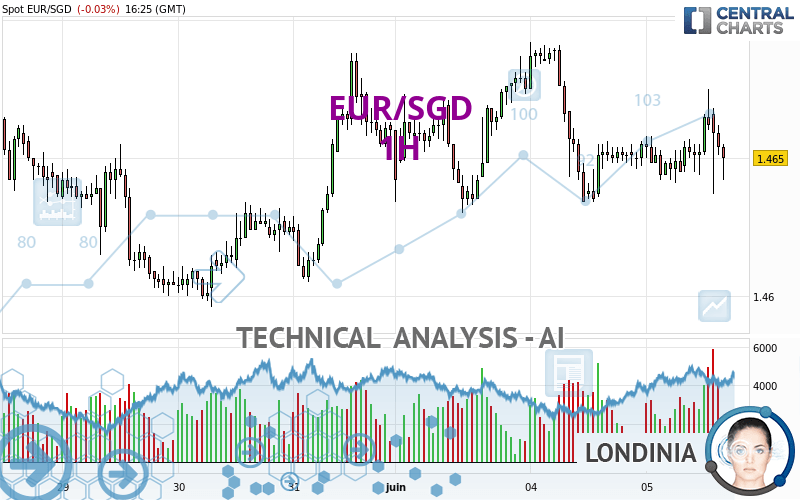
EUR/SGD - 1H - Technical analysis published on 06/05/2024 (GMT)
- 130
- 0
Click here for a new analysis!
- Timeframe : 1H
- - Analysis generated on
- Status : LEVEL MAINTAINED

Summary of the analysis

Additional analysis
Quotes
EUR/SGD rating 1.4650 SGD. The price registered a decrease of -0.03% on the session and was between 1.4637 SGD and 1.4675 SGD. This implies that the price is at +0.09% from its lowest and at -0.17% from its highest.A study of price movements over other periods shows the following variations:
Near a new LOW record (1 year)
Type : Bearish
Timeframe : Weekly
Near a new LOW record (1st january)
Type : Bearish
Timeframe : Weekly
Near a new LOW record (1 month)
Type : Bearish
Timeframe : Weekly
Technical
A technical analysis in 1H of this EUR/SGD chart shows a slightly bearish trend. 50.00% of the signals given by moving averages are bearish. This bearish trend does not seem to be increasing given the slightly bearish signals given by short-term moving averages. The Central Indicators scanner detects bearish signals on moving averages that could impact this trend:
Bearish trend reversal : adaptative moving average 50
Type : Bearish
Timeframe : 1 hour
Bearish price crossover with Moving Average 20
Type : Bearish
Timeframe : 1 hour
Bearish price crossover with Moving Average 100
Type : Bearish
Timeframe : 1 hour
Bearish price crossover with adaptative moving average 100
Type : Bearish
Timeframe : 1 hour
In fact, only 9 technical indicators out of 18 studied are currently bearish. Central Indicators, the detector scanner for these technical indicators has recently detected several signals:
MACD indicator is back under 0
Type : Bearish
Timeframe : 1 hour
Price is back under the pivot point
Type : Bearish
Timeframe : Weekly
Momentum indicator is back under 0
Type : Bearish
Timeframe : 1 hour
The analysis of the price chart with Central Patterns scanners does not return any result.
The Central Candlesticks scanner which studies Japanese candlesticks did not detect anything.
| S3 | S2 | S1 | Price | R1 | R2 | R3 | |
|---|---|---|---|---|---|---|---|
| ProTrendLines | 1.4596 | 1.4621 | 1.4634 | 1.4650 | 1.4657 | 1.4670 | 1.4692 |
| Change (%) | -0.37% | -0.20% | -0.11% | - | +0.05% | +0.14% | +0.29% |
| Change | -0.0054 | -0.0029 | -0.0016 | - | +0.0007 | +0.0020 | +0.0042 |
| Level | Minor | Minor | Major | - | Major | Intermediate | Intermediate |
Attention could also be paid to pivot points to set price objectives:
| Pivot points | S3 | S2 | S1 | PP | R1 | R2 | R3 |
|---|---|---|---|---|---|---|---|
| Standard | 1.4571 | 1.4602 | 1.4629 | 1.4660 | 1.4687 | 1.4718 | 1.4745 |
| Camarilla | 1.4639 | 1.4644 | 1.4650 | 1.4655 | 1.4660 | 1.4666 | 1.4671 |
| Woodie | 1.4568 | 1.4601 | 1.4626 | 1.4659 | 1.4684 | 1.4717 | 1.4742 |
| Fibonacci | 1.4602 | 1.4625 | 1.4638 | 1.4660 | 1.4683 | 1.4696 | 1.4718 |
| Pivot points | S3 | S2 | S1 | PP | R1 | R2 | R3 |
|---|---|---|---|---|---|---|---|
| Standard | 1.4516 | 1.4556 | 1.4608 | 1.4648 | 1.4700 | 1.4740 | 1.4792 |
| Camarilla | 1.4635 | 1.4643 | 1.4652 | 1.4660 | 1.4668 | 1.4677 | 1.4685 |
| Woodie | 1.4522 | 1.4559 | 1.4614 | 1.4651 | 1.4706 | 1.4743 | 1.4798 |
| Fibonacci | 1.4556 | 1.4591 | 1.4613 | 1.4648 | 1.4683 | 1.4705 | 1.4740 |
| Pivot points | S3 | S2 | S1 | PP | R1 | R2 | R3 |
|---|---|---|---|---|---|---|---|
| Standard | 1.4381 | 1.4448 | 1.4554 | 1.4621 | 1.4727 | 1.4794 | 1.4900 |
| Camarilla | 1.4612 | 1.4628 | 1.4644 | 1.4660 | 1.4676 | 1.4692 | 1.4708 |
| Woodie | 1.4401 | 1.4458 | 1.4574 | 1.4631 | 1.4747 | 1.4804 | 1.4920 |
| Fibonacci | 1.4448 | 1.4514 | 1.4555 | 1.4621 | 1.4687 | 1.4728 | 1.4794 |
Numerical data
The following is the status of the technical indicators and moving averages at the time of publication of this technical analysis:
| RSI (14): | 44.19 | |
| MACD (12,26,9): | 0.0000 | |
| Directional Movement: | -8.0291 | |
| AROON (14): | -7.1429 | |
| DEMA (21): | 1.4653 | |
| Parabolic SAR (0,02-0,02-0,2): | 1.4674 | |
| Elder Ray (13): | -0.0003 | |
| Super Trend (3,10): | 1.4671 | |
| Zig ZAG (10): | 1.4646 | |
| VORTEX (21): | 0.9815 | |
| Stochastique (14,3,5): | 41.23 | |
| TEMA (21): | 1.4654 | |
| Williams %R (14): | -84.21 | |
| Chande Momentum Oscillator (20): | -0.0004 | |
| Repulse (5,40,3): | -0.1007 | |
| ROCnROLL: | 2 | |
| TRIX (15,9): | -0.0010 | |
| Courbe Coppock: | 0.06 |
| MA7: | 1.4643 | |
| MA20: | 1.4628 | |
| MA50: | 1.4582 | |
| MA100: | 1.4565 | |
| MAexp7: | 1.4654 | |
| MAexp20: | 1.4654 | |
| MAexp50: | 1.4654 | |
| MAexp100: | 1.4651 | |
| Price / MA7: | +0.05% | |
| Price / MA20: | +0.15% | |
| Price / MA50: | +0.47% | |
| Price / MA100: | +0.58% | |
| Price / MAexp7: | -0.03% | |
| Price / MAexp20: | -0.03% | |
| Price / MAexp50: | -0.03% | |
| Price / MAexp100: | -0.01% |
About author
Online


Add a comment
Comments
0 comments on the analysis EUR/SGD - 1H