| Open: | 2,020 |
| Change: | -15 |
| Volume: | 735 |
| Low: | 1,927 |
| High: | 2,060 |
| High / Low range: | 133 |
| Type: | Forex |
| Ticker: | EURSGD |
| ISIN: |
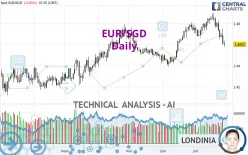
EUR/SGD - Daily - Technical analysis published on 07/28/2023 (GMT)
- 212
- 0
- 07/28/2023 - 07:35
Click here for a new analysis!
- Timeframe : Daily
- - Analysis generated on 07/28/2023 - 07:35
- Status : INVALID

Summary of the analysis

Additional analysis
Quotes
The EUR/SGD rating is 1.4602 SGD. The price registered a decrease of -0.05% on the session and was between 1.4580 SGD and 1.4639 SGD. This implies that the price is at +0.15% from its lowest and at -0.25% from its highest.The Central Gaps scanner detects a bullish opening. A small advantage for buyers in the very short term.
Bullish opening
Type : Bullish
Timeframe : Openning
Here is a more detailed summary of the historical variations registered by EUR/SGD:
Near a new HIGH record (1 year)
Type : Bullish
Timeframe : Weekly
Near a new LOW record (1st january)
Type : Bearish
Timeframe : Weekly
Near a new HIGH record (1 month)
Type : Bullish
Timeframe : Weekly
New LOW record (1 month)
Type : Bearish
Timeframe : Weekly
Technical
Technical analysis of this Daily chart of EUR/SGD indicates that the overall trend is slightly bullish. 57.14% of the signals given by moving averages are bullish. Caution: the strong bearish signals currently given by short-term moving averages indicate that a trend reversal may be taking place. There is no crossing of moving average by the price or crossing of moving averages between themselves.
The probability of a further decline is high given the direction of the technical indicators.
Caution: the Central Indicators scanner currently detects an excess:
CCI indicator is oversold : under -100
Type : Neutral
Timeframe : Daily
Williams %R indicator is oversold : under -80
Type : Neutral
Timeframe : Daily
Pivot points : price is under support 3
Type : Neutral
Timeframe : Weekly
MACD indicator is back under 0
Type : Bearish
Timeframe : Daily
The Central Patterns scanner, which studies chart patterns, resistances and supports, has identified these signals:
Near horizontal support
Type : Bullish
Timeframe : Daily
Support of channel is broken
Type : Bearish
Timeframe : Daily
No result was found by the Central Candlesticks scanner on Japanese candlesticks.
| S3 | S2 | S1 | Price | R1 | R2 | R3 | |
|---|---|---|---|---|---|---|---|
| ProTrendLines | 1.4204 | 1.4375 | 1.4479 | 1.4602 | 1.4745 | 1.4880 | 1.5317 |
| Change (%) | -2.73% | -1.55% | -0.84% | - | +0.98% | +1.90% | +4.90% |
| Change | -0.0398 | -0.0227 | -0.0123 | - | +0.0143 | +0.0278 | +0.0715 |
| Level | Intermediate | Intermediate | Minor | - | Major | Major | Minor |
To determine price objectives, it is also possible to use the pivot points. Here is the price position in relation to pivot points:
| Pivot points | S3 | S2 | S1 | PP | R1 | R2 | R3 |
|---|---|---|---|---|---|---|---|
| Standard | 1.4409 | 1.4506 | 1.4558 | 1.4655 | 1.4707 | 1.4804 | 1.4856 |
| Camarilla | 1.4568 | 1.4582 | 1.4595 | 1.4609 | 1.4623 | 1.4636 | 1.4650 |
| Woodie | 1.4386 | 1.4495 | 1.4535 | 1.4644 | 1.4684 | 1.4793 | 1.4833 |
| Fibonacci | 1.4506 | 1.4563 | 1.4598 | 1.4655 | 1.4712 | 1.4747 | 1.4804 |
| Pivot points | S3 | S2 | S1 | PP | R1 | R2 | R3 |
|---|---|---|---|---|---|---|---|
| Standard | 1.4606 | 1.4683 | 1.4744 | 1.4821 | 1.4882 | 1.4959 | 1.5020 |
| Camarilla | 1.4766 | 1.4779 | 1.4791 | 1.4804 | 1.4817 | 1.4829 | 1.4842 |
| Woodie | 1.4597 | 1.4679 | 1.4735 | 1.4817 | 1.4873 | 1.4955 | 1.5011 |
| Fibonacci | 1.4683 | 1.4736 | 1.4769 | 1.4821 | 1.4874 | 1.4907 | 1.4959 |
| Pivot points | S3 | S2 | S1 | PP | R1 | R2 | R3 |
|---|---|---|---|---|---|---|---|
| Standard | 1.4081 | 1.4239 | 1.4497 | 1.4655 | 1.4913 | 1.5071 | 1.5329 |
| Camarilla | 1.4642 | 1.4680 | 1.4718 | 1.4756 | 1.4794 | 1.4832 | 1.4870 |
| Woodie | 1.4132 | 1.4264 | 1.4548 | 1.4680 | 1.4964 | 1.5096 | 1.5380 |
| Fibonacci | 1.4239 | 1.4398 | 1.4496 | 1.4655 | 1.4814 | 1.4912 | 1.5071 |
Numerical data
The following is the status of the technical indicators and moving averages at the time of publication of this technical analysis:
| RSI (14): | 38.10 | |
| MACD (12,26,9): | -0.0003 | |
| Directional Movement: | -15.2954 | |
| AROON (14): | -50.0000 | |
| DEMA (21): | 1.4738 | |
| Parabolic SAR (0,02-0,02-0,2): | 1.4860 | |
| Elder Ray (13): | -0.0111 | |
| Super Trend (3,10): | 1.4829 | |
| Zig ZAG (10): | 1.4607 | |
| VORTEX (21): | 0.8961 | |
| Stochastique (14,3,5): | 8.67 | |
| TEMA (21): | 1.4696 | |
| Williams %R (14): | -89.97 | |
| Chande Momentum Oscillator (20): | -0.0205 | |
| Repulse (5,40,3): | -0.9156 | |
| ROCnROLL: | 2 | |
| TRIX (15,9): | 0.0327 | |
| Courbe Coppock: | 0.83 |
| MA7: | 1.4698 | |
| MA20: | 1.4755 | |
| MA50: | 1.4648 | |
| MA100: | 1.4590 | |
| MAexp7: | 1.4685 | |
| MAexp20: | 1.4725 | |
| MAexp50: | 1.4677 | |
| MAexp100: | 1.4586 | |
| Price / MA7: | -0.65% | |
| Price / MA20: | -1.04% | |
| Price / MA50: | -0.31% | |
| Price / MA100: | +0.08% | |
| Price / MAexp7: | -0.57% | |
| Price / MAexp20: | -0.84% | |
| Price / MAexp50: | -0.51% | |
| Price / MAexp100: | +0.11% |
About author
Online


Add a comment
Comments
0 comments on the analysis EUR/SGD - Daily