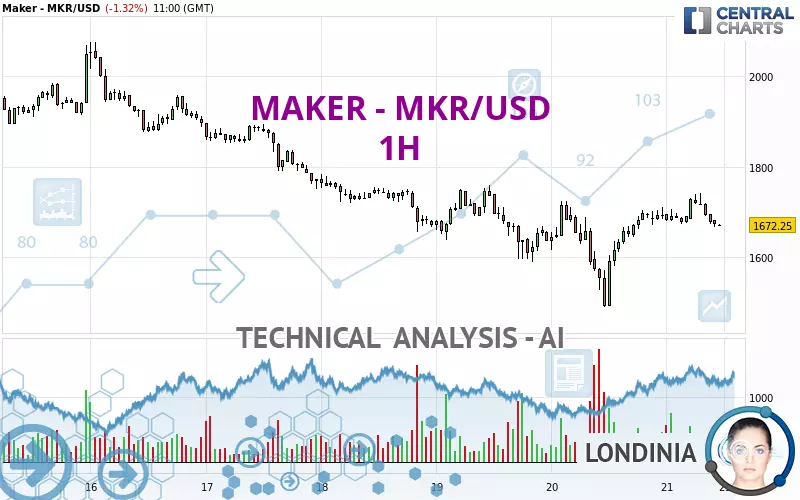
MAKER - MKR/USD - 1H - Technical analysis published on 12/21/2024 (GMT)
- 110
- 0
Click here for a new analysis!
- Timeframe : 1H
- - Analysis generated on
- Status : TARGET REACHED
Summary of the analysis

Additional analysis
Quotes
MAKER - MKR/USD rating 1,672.25 USD. The price is lower by -1.32% since the last closing and was between 1,667.27 USD and 1,743.33 USD. This implies that the price is at +0.30% from its lowest and at -4.08% from its highest.The Central Gaps scanner detects a bullish opening marking the presence of buyers ahead of sellers at the opening but not sufficiently marked to allow the price to register a quotation gap.
Bullish opening
Type : Bullish
Timeframe : Openning
Here is a more detailed summary of the historical variations registered by MAKER - MKR/USD:
New HIGH record (1st january)
Type : Bullish
Timeframe : Weekly
Technical
Technical analysis of MAKER - MKR/USD in 1H shows an overall bearish trend. 75.00% of the signals given by moving averages are bearish. Caution: the neutral signals currently given by short-term moving averages show us that the global trend is losing momentum. An assessment of moving averages reveals several bearish signals that could impact this trend:
Bearish trend reversal : adaptative moving average 20
Type : Bearish
Timeframe : 1 hour
Bearish trend reversal : adaptative moving average 50
Type : Bearish
Timeframe : 1 hour
In fact, 10 technical indicators on 18 studied are currently bearish. Caution: the Central Indicators scanner currently detects an excess:
Williams %R indicator is oversold : under -80
Type : Neutral
Timeframe : 1 hour
RSI indicator is back over 50
Type : Bullish
Timeframe : 1 hour
MACD crosses DOWN its Moving Average
Type : Bearish
Timeframe : 1 hour
Central Patterns, the scanner specializing in chart patterns, did not identify any signals.
The presence of a bullish Japanese candlestick pattern detected by Central Candlesticks that could cause a very short term rebound was also detected:
Bullish harami cross
Type : Bullish
Timeframe : 1 hour
| S3 | S2 | S1 | Price | R1 | R2 | R3 | |
|---|---|---|---|---|---|---|---|
| ProTrendLines | 1,490.36 | 1,554.46 | 1,639.53 | 1,672.25 | 1,704.20 | 1,894.31 | 2,076.03 |
| Change (%) | -10.88% | -7.04% | -1.96% | - | +1.91% | +13.28% | +24.15% |
| Change | -181.89 | -117.79 | -32.72 | - | +31.95 | +222.06 | +403.78 |
| Level | Intermediate | Major | Minor | - | Intermediate | Intermediate | Minor |
To determine price objectives, it is also possible to use the pivot points. Here is the price position in relation to pivot points:
| Pivot points | S3 | S2 | S1 | PP | R1 | R2 | R3 |
|---|---|---|---|---|---|---|---|
| Standard | 1,313.99 | 1,402.18 | 1,548.40 | 1,636.59 | 1,782.81 | 1,871.00 | 2,017.22 |
| Camarilla | 1,630.17 | 1,651.66 | 1,673.14 | 1,694.63 | 1,716.12 | 1,737.61 | 1,759.09 |
| Woodie | 1,343.02 | 1,416.69 | 1,577.43 | 1,651.10 | 1,811.84 | 1,885.51 | 2,046.25 |
| Fibonacci | 1,402.18 | 1,491.72 | 1,547.04 | 1,636.59 | 1,726.13 | 1,781.45 | 1,871.00 |
| Pivot points | S3 | S2 | S1 | PP | R1 | R2 | R3 |
|---|---|---|---|---|---|---|---|
| Standard | 1,071.47 | 1,361.99 | 1,646.22 | 1,936.74 | 2,220.97 | 2,511.49 | 2,795.72 |
| Camarilla | 1,772.40 | 1,825.09 | 1,877.78 | 1,930.46 | 1,983.15 | 2,035.83 | 2,088.52 |
| Woodie | 1,068.34 | 1,360.42 | 1,643.09 | 1,935.17 | 2,217.84 | 2,509.92 | 2,792.59 |
| Fibonacci | 1,361.99 | 1,581.54 | 1,717.18 | 1,936.74 | 2,156.29 | 2,291.93 | 2,511.49 |
| Pivot points | S3 | S2 | S1 | PP | R1 | R2 | R3 |
|---|---|---|---|---|---|---|---|
| Standard | 332.09 | 719.93 | 1,289.92 | 1,677.76 | 2,247.75 | 2,635.59 | 3,205.58 |
| Camarilla | 1,596.52 | 1,684.32 | 1,772.12 | 1,859.92 | 1,947.72 | 2,035.52 | 2,123.32 |
| Woodie | 423.18 | 765.47 | 1,381.01 | 1,723.30 | 2,338.84 | 2,681.13 | 3,296.67 |
| Fibonacci | 719.93 | 1,085.82 | 1,311.87 | 1,677.76 | 2,043.65 | 2,269.70 | 2,635.59 |
Numerical data
The following are the details of the technical indicators and moving averages that were collected to generate this technical analysis:
| RSI (14): | 50.16 | |
| MACD (12,26,9): | 10.7700 | |
| Directional Movement: | -0.73 | |
| AROON (14): | 71.43 | |
| DEMA (21): | 1,697.92 | |
| Parabolic SAR (0,02-0,02-0,2): | 1,740.52 | |
| Elder Ray (13): | -9.89 | |
| Super Trend (3,10): | 1,644.46 | |
| Zig ZAG (10): | 1,679.82 | |
| VORTEX (21): | 1.1900 | |
| Stochastique (14,3,5): | 16.23 | |
| TEMA (21): | 1,708.84 | |
| Williams %R (14): | -87.04 | |
| Chande Momentum Oscillator (20): | -11.27 | |
| Repulse (5,40,3): | -1.5800 | |
| ROCnROLL: | 2 | |
| TRIX (15,9): | 0.1100 | |
| Courbe Coppock: | 2.50 |
| MA7: | 1,771.98 | |
| MA20: | 1,962.99 | |
| MA50: | 1,712.21 | |
| MA100: | 1,553.09 | |
| MAexp7: | 1,693.20 | |
| MAexp20: | 1,683.74 | |
| MAexp50: | 1,682.89 | |
| MAexp100: | 1,722.15 | |
| Price / MA7: | -5.63% | |
| Price / MA20: | -14.81% | |
| Price / MA50: | -2.33% | |
| Price / MA100: | +7.67% | |
| Price / MAexp7: | -1.24% | |
| Price / MAexp20: | -0.68% | |
| Price / MAexp50: | -0.63% | |
| Price / MAexp100: | -2.90% |
About author
Online


Add a comment
Comments
0 comments on the analysis MAKER - MKR/USD - 1H