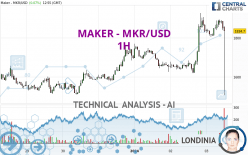
MAKER - MKR/USD - 1H - Technical analysis published on 01/03/2024 (GMT)
- 99
- 0
Click here for a new analysis!
- Timeframe : 1H
- - Analysis generated on
- Status : TARGET REACHED

Summary of the analysis

Additional analysis
Quotes
The MAKER - MKR/USD rating is 1,834.70 USD. On the day, this instrument gained +0.07% and was between 1,506.00 USD and 1,893.71 USD. This implies that the price is at +21.83% from its lowest and at -3.12% from its highest.A bearish opening was detected by the Central Gaps scanner. Sellers are trying to impose a bearish trend in the very short term.
Bearish opening
Type : Bearish
Timeframe : Openning
So that you have an overall view of the price change, here is a table showing the variations over several periods:
Near a new HIGH record (1 year)
Type : Bullish
Timeframe : Weekly
Near a new HIGH record (1st january)
Type : Bullish
Timeframe : Weekly
New LOW record (1st january)
Type : Bearish
Timeframe : Weekly
Near a new HIGH record (1 month)
Type : Bullish
Timeframe : Weekly
Technical
Technical analysis of this 1H chart of MAKER - MKR/USD indicates that the overall trend is bullish. The signals given by moving averages are 75.00% bullish. This bullish trend is slowing down slightly given the slightly bullish signals of short-term moving averages. An assessment of moving averages reveals several bearish signals that could impact this trend:
Bearish price crossover with Moving Average 20
Type : Bearish
Timeframe : 1 hour
Bearish price crossover with adaptative moving average 20
Type : Bearish
Timeframe : 1 hour
An assessment of technical indicators does not currently provide any relevant information to suggest whether the signal given by the technical indicators is more bullish or bearish.
Caution: the Central Indicators scanner currently detects an excess:
CCI indicator is oversold : under -100
Type : Neutral
Timeframe : 1 hour
Pivot points : price is over resistance 1
Type : Neutral
Timeframe : Weekly
RSI indicator is back under 50
Type : Bearish
Timeframe : 1 hour
SuperTrend indicator bearish reversal
Type : Bearish
Timeframe : 1 hour
Price is back under the pivot point
Type : Bearish
Timeframe : 1 hour
Momentum indicator is back under 0
Type : Bearish
Timeframe : 1 hour
No signals are given by Central Patterns, a market scanner specialised in chart patterns, resistances and supports.
For a small setback in the very short term, the Central Candlesticks scanner currently notes the presence of this bearish pattern in Japanese candlesticks:
Black line without upper shadow
Type : Bearish
Timeframe : 1 hour
Long black line
Type : Bearish
Timeframe : 1 hour
| S3 | S2 | S1 | Price | R1 | R2 | R3 | |
|---|---|---|---|---|---|---|---|
| ProTrendLines | 1,551.51 | 1,620.93 | 1,770.00 | 1,834.70 | 1,927.20 | 2,220.80 | 3,322.75 |
| Change (%) | -15.44% | -11.65% | -3.53% | - | +5.04% | +21.04% | +81.11% |
| Change | -283.19 | -213.77 | -64.70 | - | +92.50 | +386.10 | +1,488.05 |
| Level | Major | Intermediate | Minor | - | Intermediate | Minor | Minor |
Attention could also be paid to pivot points to set price objectives:
| Pivot points | S3 | S2 | S1 | PP | R1 | R2 | R3 |
|---|---|---|---|---|---|---|---|
| Standard | 1,350.53 | 1,484.61 | 1,659.03 | 1,793.11 | 1,967.53 | 2,101.61 | 2,276.03 |
| Camarilla | 1,748.60 | 1,776.88 | 1,805.16 | 1,833.44 | 1,861.72 | 1,890.00 | 1,918.28 |
| Woodie | 1,370.69 | 1,494.70 | 1,679.19 | 1,803.20 | 1,987.69 | 2,111.70 | 2,296.19 |
| Fibonacci | 1,484.61 | 1,602.46 | 1,675.27 | 1,793.11 | 1,910.96 | 1,983.77 | 2,101.61 |
| Pivot points | S3 | S2 | S1 | PP | R1 | R2 | R3 |
|---|---|---|---|---|---|---|---|
| Standard | 1,133.24 | 1,249.62 | 1,423.83 | 1,540.21 | 1,714.42 | 1,830.80 | 2,005.01 |
| Camarilla | 1,518.13 | 1,544.77 | 1,571.40 | 1,598.04 | 1,624.68 | 1,651.32 | 1,677.95 |
| Woodie | 1,162.16 | 1,264.08 | 1,452.75 | 1,554.67 | 1,743.34 | 1,845.26 | 2,033.93 |
| Fibonacci | 1,249.62 | 1,360.63 | 1,429.21 | 1,540.21 | 1,651.22 | 1,719.80 | 1,830.80 |
| Pivot points | S3 | S2 | S1 | PP | R1 | R2 | R3 |
|---|---|---|---|---|---|---|---|
| Standard | 878.57 | 1,066.77 | 1,381.41 | 1,569.61 | 1,884.25 | 2,072.45 | 2,387.09 |
| Camarilla | 1,557.78 | 1,603.87 | 1,649.97 | 1,696.06 | 1,742.15 | 1,788.25 | 1,834.34 |
| Woodie | 941.80 | 1,098.38 | 1,444.64 | 1,601.22 | 1,947.48 | 2,104.06 | 2,450.32 |
| Fibonacci | 1,066.77 | 1,258.85 | 1,377.52 | 1,569.61 | 1,761.69 | 1,880.36 | 2,072.45 |
Numerical data
The following are the details of the technical indicators and moving averages that were collected to generate this technical analysis:
| RSI (14): | 40.00 | |
| MACD (12,26,9): | 29.9600 | |
| Directional Movement: | -34.29 | |
| AROON (14): | -21.43 | |
| DEMA (21): | 1,861.17 | |
| Parabolic SAR (0,02-0,02-0,2): | 1,925.44 | |
| Elder Ray (13): | -149.83 | |
| Super Trend (3,10): | 1,875.13 | |
| Zig ZAG (10): | 1,754.70 | |
| VORTEX (21): | 0.9000 | |
| Stochastique (14,3,5): | 65.44 | |
| TEMA (21): | 1,869.94 | |
| Williams %R (14): | -31.47 | |
| Chande Momentum Oscillator (20): | -66.78 | |
| Repulse (5,40,3): | 1.8000 | |
| ROCnROLL: | -1 | |
| TRIX (15,9): | 0.3600 | |
| Courbe Coppock: | 2.53 |
| MA7: | 1,663.70 | |
| MA20: | 1,463.60 | |
| MA50: | 1,450.16 | |
| MA100: | 1,427.51 | |
| MAexp7: | 1,837.17 | |
| MAexp20: | 1,816.77 | |
| MAexp50: | 1,759.94 | |
| MAexp100: | 1,702.43 | |
| Price / MA7: | +10.28% | |
| Price / MA20: | +25.36% | |
| Price / MA50: | +26.52% | |
| Price / MA100: | +28.52% | |
| Price / MAexp7: | -0.13% | |
| Price / MAexp20: | +0.99% | |
| Price / MAexp50: | +4.25% | |
| Price / MAexp100: | +7.77% |
About author
Online


Add a comment
Comments
0 comments on the analysis MAKER - MKR/USD - 1H