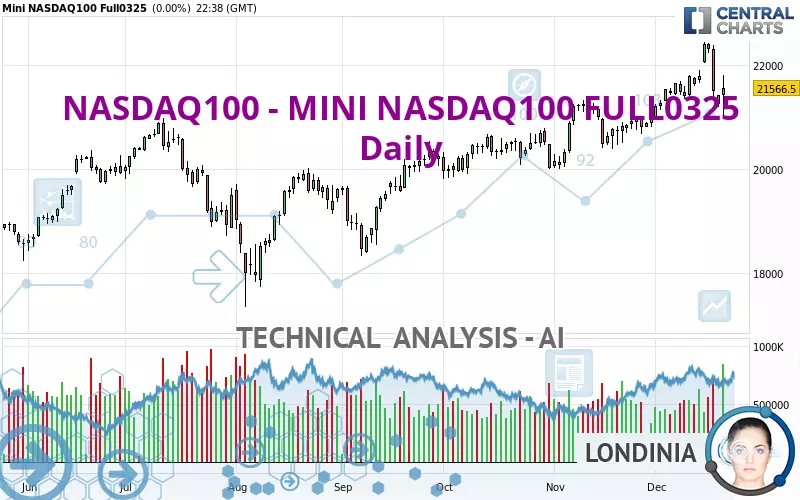
NASDAQ100 - MINI NASDAQ100 FULL0325 - Daily - Technical analysis published on 12/22/2024 (GMT)
- 88
- 0
Click here for a new analysis!
- Timeframe : Daily
- - Analysis generated on
- Status : LEVEL MAINTAINED
Summary of the analysis

Additional analysis
Quotes
The NASDAQ100 - MINI NASDAQ100 FULL0325 price is 21,566.50 USD. The price registered an increase of +0.88% on the session with the lowest point at 21,006.50 USD and the highest point at 21,812.25 USD. The deviation from the price is +2.67% for the low point and -1.13% for the high point.The Central Gaps scanner detects a bullish opening marking the presence of buyers ahead of sellers at the opening but not sufficiently marked to allow the price to register a quotation gap.
Bullish opening
Type : Bullish
Timeframe : Openning
Here is a more detailed summary of the historical variations registered by NASDAQ100 - MINI NASDAQ100 FULL0325:
New HIGH record (5 years)
Type : Bullish
Timeframe : Weekly
Near a new HIGH record (1 year)
Type : Bullish
Timeframe : Weekly
Near a new HIGH record (1st january)
Type : Bullish
Timeframe : Weekly
Near a new HIGH record (1 month)
Type : Bullish
Timeframe : Weekly
Technical
Technical analysis of NASDAQ100 - MINI NASDAQ100 FULL0325 in Daily shows an overall bullish trend. 75.00% of the signals given by moving averages are bullish. Caution: the neutral signals currently given by the short-term moving averages indicate that this bullish trend is showing signs of running out of steam. The Central Indicators market scanner is currently detecting a bullish signal that could impact this trend:
Bullish price crossover with adaptative moving average 20
Type : Bullish
Timeframe : Daily
In fact, Central Analyzer took into account 18 technical indicators and the result was as follows: 3 are bullish, 9 are neutral and 6 are bearish. Central Indicators, the scanner specialised in technical indicators, has identified these signals:
Pivot points : price is under support 1
Type : Neutral
Timeframe : Weekly
Price is back over the pivot point
Type : Bullish
Timeframe : Daily
The analysis of the price chart with Central Patterns scanners does not return any result.
No result was found by the Central Candlesticks scanner on Japanese candlesticks.
| S3 | S2 | S1 | Price | R1 | |
|---|---|---|---|---|---|
| ProTrendLines | 19,367.33 | 20,287.06 | 21,420.75 | 21,566.50 | 22,408.00 |
| Change (%) | -10.20% | -5.93% | -0.68% | - | +3.90% |
| Change | -2,199.17 | -1,279.44 | -145.75 | - | +841.50 |
| Level | Minor | Intermediate | Major | - | Intermediate |
To determine price objectives, it is also possible to use the pivot points. Here is the price position in relation to pivot points:
| Pivot points | S3 | S2 | S1 | PP | R1 | R2 | R3 |
|---|---|---|---|---|---|---|---|
| Standard | 20,898.58 | 21,122.17 | 21,250.58 | 21,474.17 | 21,602.58 | 21,826.17 | 21,954.58 |
| Camarilla | 21,282.20 | 21,314.47 | 21,346.73 | 21,379.00 | 21,411.27 | 21,443.53 | 21,475.80 |
| Woodie | 20,851.00 | 21,098.38 | 21,203.00 | 21,450.38 | 21,555.00 | 21,802.38 | 21,907.00 |
| Fibonacci | 21,122.17 | 21,256.63 | 21,339.70 | 21,474.17 | 21,608.63 | 21,691.70 | 21,826.17 |
| Pivot points | S3 | S2 | S1 | PP | R1 | R2 | R3 |
|---|---|---|---|---|---|---|---|
| Standard | 21,193.75 | 21,416.25 | 21,749.00 | 21,971.50 | 22,304.25 | 22,526.75 | 22,859.50 |
| Camarilla | 21,929.06 | 21,979.95 | 22,030.85 | 22,081.75 | 22,132.65 | 22,183.55 | 22,234.44 |
| Woodie | 21,248.88 | 21,443.81 | 21,804.13 | 21,999.06 | 22,359.38 | 22,554.31 | 22,914.63 |
| Fibonacci | 21,416.25 | 21,628.36 | 21,759.40 | 21,971.50 | 22,183.61 | 22,314.65 | 22,526.75 |
| Pivot points | S3 | S2 | S1 | PP | R1 | R2 | R3 |
|---|---|---|---|---|---|---|---|
| Standard | 19,182.33 | 19,740.67 | 20,510.08 | 21,068.42 | 21,837.83 | 22,396.17 | 23,165.58 |
| Camarilla | 20,914.37 | 21,036.08 | 21,157.79 | 21,279.50 | 21,401.21 | 21,522.92 | 21,644.63 |
| Woodie | 19,287.88 | 19,793.44 | 20,615.63 | 21,121.19 | 21,943.38 | 22,448.94 | 23,271.13 |
| Fibonacci | 19,740.67 | 20,247.87 | 20,561.22 | 21,068.42 | 21,575.62 | 21,888.97 | 22,396.17 |
Numerical data
The following is the status of technical indicators and moving averages registered at the time this technical analysis was created:
| RSI (14): | 49.86 | |
| MACD (12,26,9): | 173.3500 | |
| Directional Movement: | -8.61 | |
| AROON (14): | -28.57 | |
| DEMA (21): | 21,914.62 | |
| Parabolic SAR (0,02-0,02-0,2): | 22,404.90 | |
| Elder Ray (13): | -329.61 | |
| Super Trend (3,10): | 22,575.36 | |
| Zig ZAG (10): | 21,552.50 | |
| VORTEX (21): | 1.0200 | |
| Stochastique (14,3,5): | 26.84 | |
| TEMA (21): | 21,888.32 | |
| Williams %R (14): | -62.18 | |
| Chande Momentum Oscillator (20): | -270.00 | |
| Repulse (5,40,3): | -1.2800 | |
| ROCnROLL: | -1 | |
| TRIX (15,9): | 0.1600 | |
| Courbe Coppock: | 4.28 |
| MA7: | 21,882.11 | |
| MA20: | 21,665.58 | |
| MA50: | 21,215.95 | |
| MA100: | 20,591.02 | |
| MAexp7: | 21,739.28 | |
| MAexp20: | 21,655.96 | |
| MAexp50: | 21,271.92 | |
| MAexp100: | 20,827.68 | |
| Price / MA7: | -1.44% | |
| Price / MA20: | -0.46% | |
| Price / MA50: | +1.65% | |
| Price / MA100: | +4.74% | |
| Price / MAexp7: | -0.79% | |
| Price / MAexp20: | -0.41% | |
| Price / MAexp50: | +1.38% | |
| Price / MAexp100: | +3.55% |
About author

Online


Add a comment
Comments
0 comments on the analysis NASDAQ100 - MINI NASDAQ100 FULL0325 - Daily