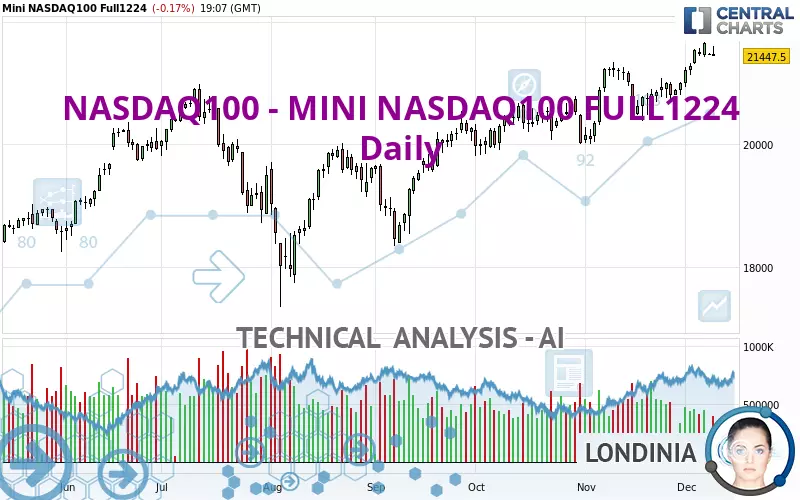
NASDAQ100 - MINI NASDAQ100 FULL0325 - Daily - Technical analysis published on 12/10/2024 (GMT)
- 111
- 0
Click here for a new analysis!
- Timeframe : Daily
- - Analysis generated on
- Status : TARGET REACHED

Summary of the analysis

Additional analysis
Quotes
NASDAQ100 - MINI NASDAQ100 FULL1224 rating 21,447.75 USD. On the day, this instrument lost -0.17% with the lowest point at 21,441.00 USD and the highest point at 21,606.75 USD. The deviation from the price is +0.03% for the low point and -0.74% for the high point.The Central Gaps scanner detects a bearish opening. A small advantage for sellers in the very short term.
Bearish opening
Type : Bearish
Timeframe : Openning
So that you have an overall view of the price change, here is a table showing the variations over several periods:
New HIGH record (5 years)
Type : Bullish
Timeframe : Weekly
Near a new HIGH record (1 year)
Type : Bullish
Timeframe : Weekly
Near a new HIGH record (1st january)
Type : Bullish
Timeframe : Weekly
Near a new LOW record (1 month)
Type : Bearish
Timeframe : Weekly
Technical
Technical analysis of this Daily chart of NASDAQ100 - MINI NASDAQ100 FULL1224 indicates that the overall trend is strongly bullish. The signals given by the moving averages are 92.86% bullish. This strong bullish trend is confirmed by the strong signals currently being given by short-term moving averages. The Central Indicators scanner does not detect any result on moving averages that would impact this trend.
An assessment of technical indicators shows a strong bullish signal.
But beware of excesses. The Central Indicators scanner currently detects this:
CCI indicator is overbought : over 100
Type : Neutral
Timeframe : Daily
MACD indicator: bearish divergence
Type : Bearish
Timeframe : Daily
Central Patterns, the scanner specializing in chart patterns, did not identify any signals.
The Central Candlesticks scanner which studies Japanese candlesticks did not detect anything.
| S3 | S2 | S1 | Price | |
|---|---|---|---|---|
| ProTrendLines | 20,148.05 | 20,815.22 | 21,134.75 | 21,447.75 |
| Change (%) | -6.06% | -2.95% | -1.46% | - |
| Change | -1,299.70 | -632.53 | -313.00 | - |
| Level | Minor | Major | Major | - |
Attention could also be paid to pivot points to set price objectives:
| Pivot points | S3 | S2 | S1 | PP | R1 | R2 | R3 |
|---|---|---|---|---|---|---|---|
| Standard | 21,107.50 | 21,271.75 | 21,377.75 | 21,542.00 | 21,648.00 | 21,812.25 | 21,918.25 |
| Camarilla | 21,409.43 | 21,434.20 | 21,458.98 | 21,483.75 | 21,508.52 | 21,533.30 | 21,558.07 |
| Woodie | 21,078.38 | 21,257.19 | 21,348.63 | 21,527.44 | 21,618.88 | 21,797.69 | 21,889.13 |
| Fibonacci | 21,271.75 | 21,374.99 | 21,438.77 | 21,542.00 | 21,645.24 | 21,709.02 | 21,812.25 |
| Pivot points | S3 | S2 | S1 | PP | R1 | R2 | R3 |
|---|---|---|---|---|---|---|---|
| Standard | 20,445.50 | 20,692.75 | 21,174.75 | 21,422.00 | 21,904.00 | 22,151.25 | 22,633.25 |
| Camarilla | 21,456.21 | 21,523.05 | 21,589.90 | 21,656.75 | 21,723.60 | 21,790.45 | 21,857.29 |
| Woodie | 20,562.88 | 20,751.44 | 21,292.13 | 21,480.69 | 22,021.38 | 22,209.94 | 22,750.63 |
| Fibonacci | 20,692.75 | 20,971.32 | 21,143.43 | 21,422.00 | 21,700.57 | 21,872.68 | 22,151.25 |
| Pivot points | S3 | S2 | S1 | PP | R1 | R2 | R3 |
|---|---|---|---|---|---|---|---|
| Standard | 18,896.33 | 19,454.67 | 20,224.08 | 20,782.42 | 21,551.83 | 22,110.17 | 22,879.58 |
| Camarilla | 20,628.37 | 20,750.08 | 20,871.79 | 20,993.50 | 21,115.21 | 21,236.92 | 21,358.63 |
| Woodie | 19,001.88 | 19,507.44 | 20,329.63 | 20,835.19 | 21,657.38 | 22,162.94 | 22,985.13 |
| Fibonacci | 19,454.67 | 19,961.87 | 20,275.22 | 20,782.42 | 21,289.62 | 21,602.97 | 22,110.17 |
Numerical data
The following is the status of the technical indicators and moving averages at the time of publication of this technical analysis:
| RSI (14): | 62.17 | |
| MACD (12,26,9): | 238.0100 | |
| Directional Movement: | 16.33 | |
| AROON (14): | 92.86 | |
| DEMA (21): | 21,433.36 | |
| Parabolic SAR (0,02-0,02-0,2): | 20,818.09 | |
| Elder Ray (13): | 265.70 | |
| Super Trend (3,10): | 20,783.18 | |
| Zig ZAG (10): | 21,451.25 | |
| VORTEX (21): | 1.0500 | |
| Stochastique (14,3,5): | 86.24 | |
| TEMA (21): | 21,505.39 | |
| Williams %R (14): | -21.33 | |
| Chande Momentum Oscillator (20): | 606.00 | |
| Repulse (5,40,3): | -0.1800 | |
| ROCnROLL: | 1 | |
| TRIX (15,9): | 0.1300 | |
| Courbe Coppock: | 5.57 |
| MA7: | 21,443.04 | |
| MA20: | 21,058.39 | |
| MA50: | 20,708.78 | |
| MA100: | 20,120.64 | |
| MAexp7: | 21,400.15 | |
| MAexp20: | 21,134.16 | |
| MAexp50: | 20,756.43 | |
| MAexp100: | 20,356.28 | |
| Price / MA7: | +0.02% | |
| Price / MA20: | +1.85% | |
| Price / MA50: | +3.57% | |
| Price / MA100: | +6.60% | |
| Price / MAexp7: | +0.22% | |
| Price / MAexp20: | +1.48% | |
| Price / MAexp50: | +3.33% | |
| Price / MAexp100: | +5.36% |
About author

Online


Add a comment
Comments
0 comments on the analysis NASDAQ100 - MINI NASDAQ100 FULL0325 - Daily