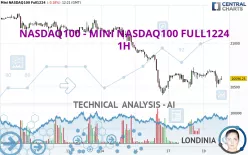
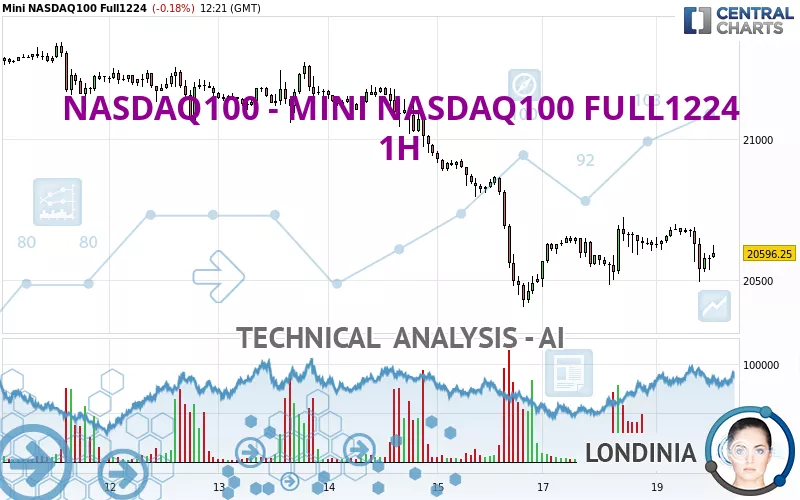
NASDAQ100 - MINI NASDAQ100 FULL0625 - 1H - Technical analysis published on 11/19/2024 (GMT)
- 95
- 0
Click here for a new analysis!
- Timeframe : 1H
- - Analysis generated on
- Status : TARGET REACHED
Summary of the analysis

Additional analysis
Quotes
NASDAQ100 - MINI NASDAQ100 FULL1224 rating 20,596.25 USD. The price is lower by -0.18% since the last closing with the lowest point at 20,492.75 USD and the highest point at 20,697.00 USD. The deviation from the price is +0.51% for the low point and -0.49% for the high point.The Central Gaps scanner detects a bearish opening marking the presence of sellers ahead of buyers at the opening but not sufficiently marked to allow the price to register a quotation gap.
Bearish opening
Type : Bearish
Timeframe : Openning
Here is a more detailed summary of the historical variations registered by NASDAQ100 - MINI NASDAQ100 FULL1224:
Near a new HIGH record (5 years)
Type : Bullish
Timeframe : Weekly
Near a new HIGH record (1 year)
Type : Bullish
Timeframe : Weekly
Near a new HIGH record (1st january)
Type : Bullish
Timeframe : Weekly
Near a new HIGH record (1 month)
Type : Bullish
Timeframe : Weekly
Technical
Technical analysis of this 1H chart of NASDAQ100 - MINI NASDAQ100 FULL1224 indicates that the overall trend is strongly bearish. 89.29% of the signals given by moving averages are bearish. This strongly bearish trend is supported by the strong bearish signals given by short-term moving averages. There is no crossing of moving average by the price or crossing of moving averages between themselves.
The technical indicators are generally neutral. They do not provide relevant information on the direction of future price movements.
Central Indicators, the detector scanner for these technical indicators recently detected a signal:
Williams %R indicator is back over -50
Type : Bullish
Timeframe : 1 hour
The analysis of the price chart with Central Patterns scanners does not return any result.
No result was found by the Central Candlesticks scanner on Japanese candlesticks.
| S3 | S2 | S1 | Price | R1 | R2 | R3 | |
|---|---|---|---|---|---|---|---|
| ProTrendLines | 20,144.50 | 20,405.25 | 20,481.50 | 20,596.25 | 20,619.25 | 20,724.25 | 20,933.17 |
| Change (%) | -2.19% | -0.93% | -0.56% | - | +0.11% | +0.62% | +1.64% |
| Change | -451.75 | -191.00 | -114.75 | - | +23.00 | +128.00 | +336.92 |
| Level | Intermediate | Intermediate | Intermediate | - | Intermediate | Minor | Minor |
To determine price objectives, it is also possible to use the pivot points. Here is the price position in relation to pivot points:
| Pivot points | S3 | S2 | S1 | PP | R1 | R2 | R3 |
|---|---|---|---|---|---|---|---|
| Standard | 20,250.00 | 20,363.00 | 20,498.25 | 20,611.25 | 20,746.50 | 20,859.50 | 20,994.75 |
| Camarilla | 20,565.23 | 20,587.99 | 20,610.74 | 20,633.50 | 20,656.26 | 20,679.01 | 20,701.77 |
| Woodie | 20,261.13 | 20,368.56 | 20,509.38 | 20,616.81 | 20,757.63 | 20,865.06 | 21,005.88 |
| Fibonacci | 20,363.00 | 20,457.83 | 20,516.42 | 20,611.25 | 20,706.08 | 20,764.67 | 20,859.50 |
| Pivot points | S3 | S2 | S1 | PP | R1 | R2 | R3 |
|---|---|---|---|---|---|---|---|
| Standard | 19,216.92 | 19,811.08 | 20,152.42 | 20,746.58 | 21,087.92 | 21,682.08 | 22,023.42 |
| Camarilla | 20,236.49 | 20,322.24 | 20,408.00 | 20,493.75 | 20,579.50 | 20,665.26 | 20,751.01 |
| Woodie | 19,090.50 | 19,747.88 | 20,026.00 | 20,683.38 | 20,961.50 | 21,618.88 | 21,897.00 |
| Fibonacci | 19,811.08 | 20,168.44 | 20,389.22 | 20,746.58 | 21,103.94 | 21,324.72 | 21,682.08 |
| Pivot points | S3 | S2 | S1 | PP | R1 | R2 | R3 |
|---|---|---|---|---|---|---|---|
| Standard | 18,773.33 | 19,303.42 | 19,728.33 | 20,258.42 | 20,683.33 | 21,213.42 | 21,638.33 |
| Camarilla | 19,890.63 | 19,978.17 | 20,065.71 | 20,153.25 | 20,240.79 | 20,328.33 | 20,415.88 |
| Woodie | 18,720.75 | 19,277.13 | 19,675.75 | 20,232.13 | 20,630.75 | 21,187.13 | 21,585.75 |
| Fibonacci | 19,303.42 | 19,668.23 | 19,893.61 | 20,258.42 | 20,623.23 | 20,848.61 | 21,213.42 |
Numerical data
The following are the details of the technical indicators and moving averages that were collected to generate this technical analysis:
| RSI (14): | 47.19 | |
| MACD (12,26,9): | -12.7100 | |
| Directional Movement: | -12.03 | |
| AROON (14): | -35.71 | |
| DEMA (21): | 20,609.08 | |
| Parabolic SAR (0,02-0,02-0,2): | 20,694.70 | |
| Elder Ray (13): | -19.41 | |
| Super Trend (3,10): | 20,742.35 | |
| Zig ZAG (10): | 20,615.50 | |
| VORTEX (21): | 1.0600 | |
| Stochastique (14,3,5): | 48.31 | |
| TEMA (21): | 20,622.71 | |
| Williams %R (14): | -39.66 | |
| Chande Momentum Oscillator (20): | -10.00 | |
| Repulse (5,40,3): | 0.2400 | |
| ROCnROLL: | 2 | |
| TRIX (15,9): | 0.0000 | |
| Courbe Coppock: | 0.23 |
| MA7: | 20,902.75 | |
| MA20: | 20,654.91 | |
| MA50: | 20,348.41 | |
| MA100: | 20,036.67 | |
| MAexp7: | 20,608.38 | |
| MAexp20: | 20,625.07 | |
| MAexp50: | 20,681.18 | |
| MAexp100: | 20,780.57 | |
| Price / MA7: | -1.47% | |
| Price / MA20: | -0.28% | |
| Price / MA50: | +1.22% | |
| Price / MA100: | +2.79% | |
| Price / MAexp7: | -0.06% | |
| Price / MAexp20: | -0.14% | |
| Price / MAexp50: | -0.41% | |
| Price / MAexp100: | -0.89% |
About author

Online


Add a comment
Comments
0 comments on the analysis NASDAQ100 - MINI NASDAQ100 FULL0625 - 1H