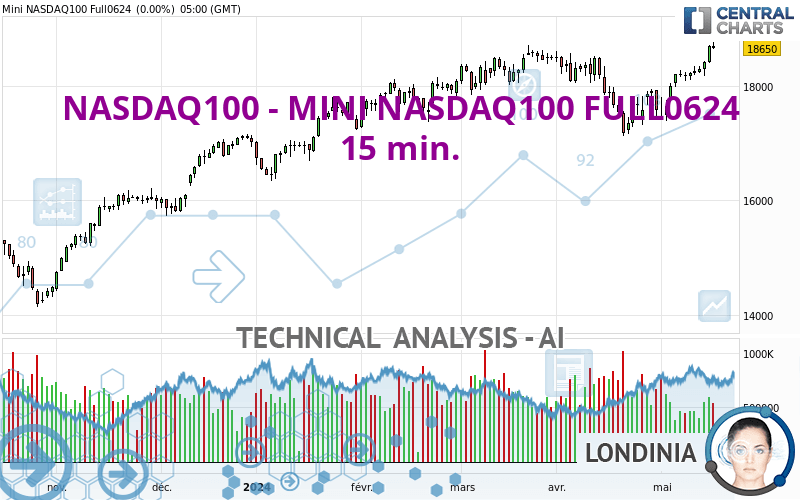
NASDAQ100 - MINI NASDAQ100 FULL0624 - 15 min. - Technical analysis published on 05/17/2024 (GMT)
- 65
- 0
- Timeframe : 15 min.
- - Analysis generated on
- Status : NEUTRAL

Summary of the analysis

Additional analysis
Quotes
NASDAQ100 - MINI NASDAQ100 FULL0624 rating 18,647.75 USD. The price registered a decrease of -0.01% on the session and was between 18,617.00 USD and 18,686.75 USD. This implies that the price is at +0.17% from its lowest and at -0.21% from its highest.The Central Gaps scanner detects a bearish opening marking the presence of sellers ahead of buyers at the opening but not sufficiently marked to allow the price to register a quotation gap.
Bearish opening
Type : Bearish
Timeframe : Openning
Here is a more detailed summary of the historical variations registered by NASDAQ100 - MINI NASDAQ100 FULL0624:
New HIGH record (5 years)
Type : Bullish
Timeframe : Weekly
Near a new HIGH record (1 year)
Type : Bullish
Timeframe : Weekly
Near a new HIGH record (1st january)
Type : Bullish
Timeframe : Weekly
Near a new HIGH record (1 month)
Type : Bullish
Timeframe : Weekly
Technical
A technical analysis in 15 min. of this NASDAQ100 - MINI NASDAQ100 FULL0624 chart shows a neutral trend. The slightly bearish signals currently given by short-term moving averages could allow the overall trend to return to a slightly bearish trend. The Central Indicators scanner detects bearish signals on moving averages that could impact this trend:
Bearish price crossover with Moving Average 100
Type : Bearish
Timeframe : 15 minutes
Bearish price crossover with adaptative moving average 20
Type : Bearish
Timeframe : 15 minutes
Bearish price crossover with adaptative moving average 50
Type : Bearish
Timeframe : 15 minutes
In fact, Central Analyzer took into account 18 technical indicators and the result was as follows: 6 are bullish, 6 are neutral and 6 are bearish. Central Indicators, the detector scanner for these technical indicators has recently detected several signals:
Pivot points : price is over resistance 2
Type : Neutral
Timeframe : Weekly
MACD crosses DOWN its Moving Average
Type : Bearish
Timeframe : 15 minutes
No signals are given by Central Patterns, a market scanner specialised in chart patterns, resistances and supports.
No result was found by the Central Candlesticks scanner on Japanese candlesticks.
| S3 | S2 | S1 | Price | R1 | R2 | |
|---|---|---|---|---|---|---|
| ProTrendLines | 18,266.05 | 18,393.06 | 18,585.75 | 18,647.75 | 18,672.00 | 18,760.75 |
| Change (%) | -2.05% | -1.37% | -0.33% | - | +0.13% | +0.61% |
| Change | -381.70 | -254.69 | -62.00 | - | +24.25 | +113.00 |
| Level | Intermediate | Minor | Major | - | Minor | Major |
Pivot points can also be used to set your price objectives. Here is the price situation in relation to pivot points:
| Pivot points | S3 | S2 | S1 | PP | R1 | R2 | R3 |
|---|---|---|---|---|---|---|---|
| Standard | 18,474.42 | 18,553.83 | 18,601.92 | 18,681.33 | 18,729.42 | 18,808.83 | 18,856.92 |
| Camarilla | 18,614.94 | 18,626.63 | 18,638.31 | 18,650.00 | 18,661.69 | 18,673.38 | 18,685.06 |
| Woodie | 18,458.75 | 18,546.00 | 18,586.25 | 18,673.50 | 18,713.75 | 18,801.00 | 18,841.25 |
| Fibonacci | 18,553.83 | 18,602.54 | 18,632.63 | 18,681.33 | 18,730.04 | 18,760.13 | 18,808.83 |
| Pivot points | S3 | S2 | S1 | PP | R1 | R2 | R3 |
|---|---|---|---|---|---|---|---|
| Standard | 17,678.92 | 17,831.33 | 18,043.17 | 18,195.58 | 18,407.42 | 18,559.83 | 18,771.67 |
| Camarilla | 18,154.83 | 18,188.22 | 18,221.61 | 18,255.00 | 18,288.39 | 18,321.78 | 18,355.17 |
| Woodie | 17,708.63 | 17,846.19 | 18,072.88 | 18,210.44 | 18,437.13 | 18,574.69 | 18,801.38 |
| Fibonacci | 17,831.33 | 17,970.48 | 18,056.44 | 18,195.58 | 18,334.73 | 18,420.69 | 18,559.83 |
| Pivot points | S3 | S2 | S1 | PP | R1 | R2 | R3 |
|---|---|---|---|---|---|---|---|
| Standard | 15,390.25 | 16,251.75 | 16,845.00 | 17,706.50 | 18,299.75 | 19,161.25 | 19,754.50 |
| Camarilla | 17,038.19 | 17,171.55 | 17,304.90 | 17,438.25 | 17,571.60 | 17,704.95 | 17,838.31 |
| Woodie | 15,256.13 | 16,184.69 | 16,710.88 | 17,639.44 | 18,165.63 | 19,094.19 | 19,620.38 |
| Fibonacci | 16,251.75 | 16,807.47 | 17,150.79 | 17,706.50 | 18,262.22 | 18,605.54 | 19,161.25 |
Numerical data
The following is the status of technical indicators and moving averages registered at the time this technical analysis was created:
| RSI (14): | 55.65 | |
| MACD (12,26,9): | 6.6500 | |
| Directional Movement: | 8.41 | |
| AROON (14): | 78.57 | |
| DEMA (21): | 18,672.18 | |
| Parabolic SAR (0,02-0,02-0,2): | 18,686.75 | |
| Elder Ray (13): | -1.73 | |
| Super Trend (3,10): | 18,644.30 | |
| Zig ZAG (10): | 18,658.25 | |
| VORTEX (21): | 1.1100 | |
| Stochastique (14,3,5): | 69.37 | |
| TEMA (21): | 18,676.74 | |
| Williams %R (14): | -84.91 | |
| Chande Momentum Oscillator (20): | -1.25 | |
| Repulse (5,40,3): | -0.0700 | |
| ROCnROLL: | 2 | |
| TRIX (15,9): | 0.0000 | |
| Courbe Coppock: | 0.20 |
| MA7: | 18,451.96 | |
| MA20: | 18,018.81 | |
| MA50: | 18,146.36 | |
| MA100: | 17,954.78 | |
| MAexp7: | 18,662.41 | |
| MAexp20: | 18,666.27 | |
| MAexp50: | 18,662.98 | |
| MAexp100: | 18,661.67 | |
| Price / MA7: | +1.06% | |
| Price / MA20: | +3.49% | |
| Price / MA50: | +2.76% | |
| Price / MA100: | +3.86% | |
| Price / MAexp7: | -0.08% | |
| Price / MAexp20: | -0.10% | |
| Price / MAexp50: | -0.08% | |
| Price / MAexp100: | -0.07% |
About author

Online


Add a comment
Comments
0 comments on the analysis NASDAQ100 - MINI NASDAQ100 FULL0624 - 15 min.