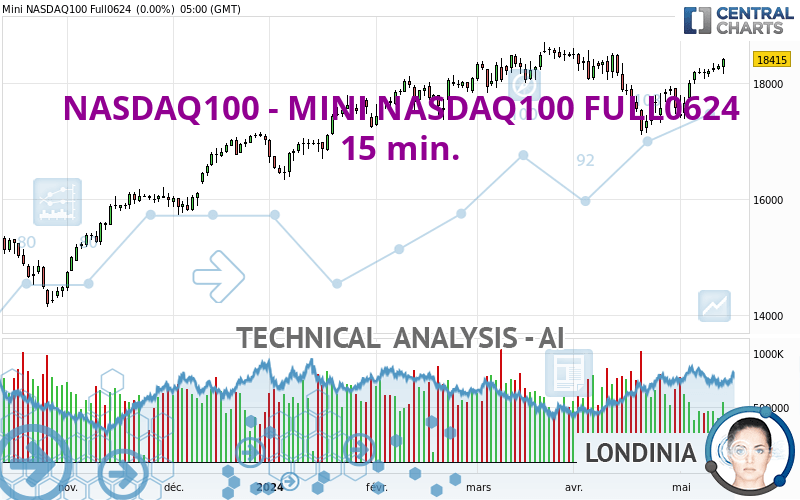
NASDAQ100 - MINI NASDAQ100 FULL0624 - 15 min. - Technical analysis published on 05/15/2024 (GMT)
- Who voted?
- 67
- 0
Click here for a new analysis!
- Timeframe : 15 min.
- - Analysis generated on
- Status : LEVEL MAINTAINED

Summary of the analysis

Additional analysis
Quotes
NASDAQ100 - MINI NASDAQ100 FULL0624 rating 18,668.75 USD. The price registered an increase of +1.38% on the session with the lowest point at 18,393.00 USD and the highest point at 18,670.25 USD. The deviation from the price is +1.50% for the low point and -0.01% for the high point.The Central Gaps scanner detects a bearish opening. A small advantage for sellers in the very short term.
Bearish opening
Type : Bearish
Timeframe : Openning
So that you have an overall view of the price change, here is a table showing the variations over several periods:
Near a new HIGH record (5 years)
Type : Bullish
Timeframe : Weekly
Near a new HIGH record (1 year)
Type : Bullish
Timeframe : Weekly
Near a new HIGH record (1st january)
Type : Bullish
Timeframe : Weekly
New HIGH record (1 month)
Type : Bullish
Timeframe : Weekly
Technical
A technical analysis in 15 min. of this NASDAQ100 - MINI NASDAQ100 FULL0624 chart shows a strongly bullish trend. 92.86% of the signals given by moving averages are bullish. This strongly bullish trend is supported by the strong bullish signals given by short-term moving averages. The Central Indicators scanner does not detect any result on moving averages that would impact this trend.
An assessment of technical indicators shows a strong bullish signal.
But beware of excesses. The Central Indicators scanner currently detects this:
RSI indicator is overbought : over 80
Type : Neutral
Timeframe : 15 minutes
CCI indicator is overbought : over 100
Type : Neutral
Timeframe : 15 minutes
Williams %R indicator is overbought : over -20
Type : Neutral
Timeframe : 15 minutes
Pivot points : price is over resistance 2
Type : Neutral
Timeframe : 15 minutes
Pivot points : price is over resistance 2
Type : Neutral
Timeframe : Weekly
Central Patterns, the scanner specializing in chart patterns, did not identify any signals.
The Central Candlesticks scanner, specialised in Japanese candlesticks, did not identify any signals.
| S3 | S2 | S1 | Price | |
|---|---|---|---|---|
| ProTrendLines | 18,266.69 | 18,433.00 | 18,585.75 | 18,668.75 |
| Change (%) | -2.15% | -1.26% | -0.44% | - |
| Change | -402.06 | -235.75 | -83.00 | - |
| Level | Intermediate | Intermediate | Major | - |
To determine price objectives, it is also possible to use the pivot points. Here is the price position in relation to pivot points:
| Pivot points | S3 | S2 | S1 | PP | R1 | R2 | R3 |
|---|---|---|---|---|---|---|---|
| Standard | 17,975.17 | 18,070.33 | 18,242.67 | 18,337.83 | 18,510.17 | 18,605.33 | 18,777.67 |
| Camarilla | 18,341.44 | 18,365.96 | 18,390.48 | 18,415.00 | 18,439.52 | 18,464.04 | 18,488.56 |
| Woodie | 18,013.75 | 18,089.63 | 18,281.25 | 18,357.13 | 18,548.75 | 18,624.63 | 18,816.25 |
| Fibonacci | 18,070.33 | 18,172.52 | 18,235.65 | 18,337.83 | 18,440.02 | 18,503.15 | 18,605.33 |
| Pivot points | S3 | S2 | S1 | PP | R1 | R2 | R3 |
|---|---|---|---|---|---|---|---|
| Standard | 17,678.92 | 17,831.33 | 18,043.17 | 18,195.58 | 18,407.42 | 18,559.83 | 18,771.67 |
| Camarilla | 18,154.83 | 18,188.22 | 18,221.61 | 18,255.00 | 18,288.39 | 18,321.78 | 18,355.17 |
| Woodie | 17,708.63 | 17,846.19 | 18,072.88 | 18,210.44 | 18,437.13 | 18,574.69 | 18,801.38 |
| Fibonacci | 17,831.33 | 17,970.48 | 18,056.44 | 18,195.58 | 18,334.73 | 18,420.69 | 18,559.83 |
| Pivot points | S3 | S2 | S1 | PP | R1 | R2 | R3 |
|---|---|---|---|---|---|---|---|
| Standard | 15,390.25 | 16,251.75 | 16,845.00 | 17,706.50 | 18,299.75 | 19,161.25 | 19,754.50 |
| Camarilla | 17,038.19 | 17,171.55 | 17,304.90 | 17,438.25 | 17,571.60 | 17,704.95 | 17,838.31 |
| Woodie | 15,256.13 | 16,184.69 | 16,710.88 | 17,639.44 | 18,165.63 | 19,094.19 | 19,620.38 |
| Fibonacci | 16,251.75 | 16,807.47 | 17,150.79 | 17,706.50 | 18,262.22 | 18,605.54 | 19,161.25 |
Numerical data
The following is the status of technical indicators and moving averages registered at the time this technical analysis was created:
| RSI (14): | 82.21 | |
| MACD (12,26,9): | 50.4400 | |
| Directional Movement: | 29.76 | |
| AROON (14): | 100.00 | |
| DEMA (21): | 18,631.36 | |
| Parabolic SAR (0,02-0,02-0,2): | 18,579.01 | |
| Elder Ray (13): | 50.36 | |
| Super Trend (3,10): | 18,572.36 | |
| Zig ZAG (10): | 18,645.00 | |
| VORTEX (21): | 1.3300 | |
| Stochastique (14,3,5): | 98.99 | |
| TEMA (21): | 18,657.78 | |
| Williams %R (14): | -0.33 | |
| Chande Momentum Oscillator (20): | 89.00 | |
| Repulse (5,40,3): | 0.1700 | |
| ROCnROLL: | 1 | |
| TRIX (15,9): | 0.0400 | |
| Courbe Coppock: | 1.29 |
| MA7: | 18,318.25 | |
| MA20: | 17,887.44 | |
| MA50: | 18,136.37 | |
| MA100: | 17,928.13 | |
| MAexp7: | 18,632.25 | |
| MAexp20: | 18,568.46 | |
| MAexp50: | 18,500.37 | |
| MAexp100: | 18,446.85 | |
| Price / MA7: | +1.91% | |
| Price / MA20: | +4.37% | |
| Price / MA50: | +2.94% | |
| Price / MA100: | +4.13% | |
| Price / MAexp7: | +0.20% | |
| Price / MAexp20: | +0.54% | |
| Price / MAexp50: | +0.91% | |
| Price / MAexp100: | +1.20% |
About author

Online


Add a comment
Comments
0 comments on the analysis NASDAQ100 - MINI NASDAQ100 FULL0624 - 15 min.