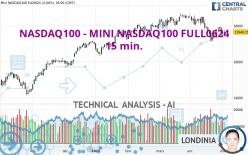
NASDAQ100 - MINI NASDAQ100 FULL0624 - 15 min. - Technical analysis published on 05/03/2024 (GMT)
- 59
- 0
Click here for a new analysis!
- Timeframe : 15 min.
- - Analysis generated on
- Status : LEVEL MAINTAINED

Summary of the analysis

Additional analysis
Quotes
The NASDAQ100 - MINI NASDAQ100 FULL0624 rating is 17,991.25 USD. The price registered an increase of +1.94% on the session and was between 17,719.50 USD and 17,996.00 USD. This implies that the price is at +1.53% from its lowest and at -0.03% from its highest.The Central Gaps scanner detects a bullish opening marking the presence of buyers ahead of sellers at the opening but not sufficiently marked to allow the price to register a quotation gap.
Bullish opening
Type : Bullish
Timeframe : Openning
Here is a more detailed summary of the historical variations registered by NASDAQ100 - MINI NASDAQ100 FULL0624:
Near a new HIGH record (5 years)
Type : Bullish
Timeframe : Weekly
Near a new HIGH record (1 year)
Type : Bullish
Timeframe : Weekly
Near a new HIGH record (1st january)
Type : Bullish
Timeframe : Weekly
Near a new HIGH record (1 month)
Type : Bullish
Timeframe : Weekly
Technical
A technical analysis in 15 min. of this NASDAQ100 - MINI NASDAQ100 FULL0624 chart shows a strongly bullish trend. 92.86% of the signals given by moving averages are bullish. The overall trend is supported by the strong bullish signals from short-term moving averages. The Central Indicators scanner does not detect any result on moving averages that would impact this trend.
The probability of a further increase is high given the direction of the technical indicators.
But beware of excesses. The Central Indicators scanner currently detects this:
CCI indicator is overbought : over 100
Type : Neutral
Timeframe : 15 minutes
Previous candle closed over Bollinger bands
Type : Neutral
Timeframe : 15 minutes
Williams %R indicator is overbought : over -20
Type : Neutral
Timeframe : 15 minutes
Pivot points : price is over resistance 1
Type : Neutral
Timeframe : 15 minutes
Central Patterns, the scanner specializing in chart patterns, did not identify any signals.
From the Japanese candlestick perspective, the Central Candlesticks scanner notes the presence of these results that could impact the short-term trend:
Bearish harami
Type : Bearish
Timeframe : 15 minutes
Doji
Type : Neutral
Timeframe : 15 minutes
| S3 | S2 | S1 | Price | R1 | R2 | |
|---|---|---|---|---|---|---|
| ProTrendLines | 17,668.00 | 17,767.10 | 17,949.00 | 17,991.25 | 18,064.75 | 18,585.75 |
| Change (%) | -1.80% | -1.25% | -0.23% | - | +0.41% | +3.30% |
| Change | -323.25 | -224.15 | -42.25 | - | +73.50 | +594.50 |
| Level | Minor | Major | Minor | - | Minor | Major |
Attention could also be paid to pivot points to set price objectives:
| Pivot points | S3 | S2 | S1 | PP | R1 | R2 | R3 |
|---|---|---|---|---|---|---|---|
| Standard | 17,069.92 | 17,228.08 | 17,438.92 | 17,597.08 | 17,807.92 | 17,966.08 | 18,176.92 |
| Camarilla | 17,548.28 | 17,582.10 | 17,615.93 | 17,649.75 | 17,683.58 | 17,717.40 | 17,751.23 |
| Woodie | 17,096.25 | 17,241.25 | 17,465.25 | 17,610.25 | 17,834.25 | 17,979.25 | 18,203.25 |
| Fibonacci | 17,228.08 | 17,369.04 | 17,456.13 | 17,597.08 | 17,738.04 | 17,825.13 | 17,966.08 |
| Pivot points | S3 | S2 | S1 | PP | R1 | R2 | R3 |
|---|---|---|---|---|---|---|---|
| Standard | 16,609.33 | 16,878.92 | 17,362.33 | 17,631.92 | 18,115.33 | 18,384.92 | 18,868.33 |
| Camarilla | 17,638.68 | 17,707.70 | 17,776.73 | 17,845.75 | 17,914.78 | 17,983.80 | 18,052.83 |
| Woodie | 16,716.25 | 16,932.38 | 17,469.25 | 17,685.38 | 18,222.25 | 18,438.38 | 18,975.25 |
| Fibonacci | 16,878.92 | 17,166.56 | 17,344.27 | 17,631.92 | 17,919.56 | 18,097.27 | 18,384.92 |
| Pivot points | S3 | S2 | S1 | PP | R1 | R2 | R3 |
|---|---|---|---|---|---|---|---|
| Standard | 15,390.25 | 16,251.75 | 16,845.00 | 17,706.50 | 18,299.75 | 19,161.25 | 19,754.50 |
| Camarilla | 17,038.19 | 17,171.55 | 17,304.90 | 17,438.25 | 17,571.60 | 17,704.95 | 17,838.31 |
| Woodie | 15,256.13 | 16,184.69 | 16,710.88 | 17,639.44 | 18,165.63 | 19,094.19 | 19,620.38 |
| Fibonacci | 16,251.75 | 16,807.47 | 17,150.79 | 17,706.50 | 18,262.22 | 18,605.54 | 19,161.25 |
Numerical data
The following is the status of technical indicators and moving averages registered at the time this technical analysis was created:
| RSI (14): | 78.06 | |
| MACD (12,26,9): | 39.9400 | |
| Directional Movement: | 37.84 | |
| AROON (14): | 21.43 | |
| DEMA (21): | 17,854.26 | |
| Parabolic SAR (0,02-0,02-0,2): | 17,752.01 | |
| Elder Ray (13): | 95.25 | |
| Super Trend (3,10): | 17,823.98 | |
| Zig ZAG (10): | 17,930.50 | |
| VORTEX (21): | 1.3000 | |
| Stochastique (14,3,5): | 86.97 | |
| TEMA (21): | 17,889.28 | |
| Williams %R (14): | -0.56 | |
| Chande Momentum Oscillator (20): | 192.50 | |
| Repulse (5,40,3): | 0.3800 | |
| ROCnROLL: | 1 | |
| TRIX (15,9): | 0.0200 | |
| Courbe Coppock: | 1.44 |
| MA7: | 17,706.00 | |
| MA20: | 17,809.78 | |
| MA50: | 18,136.60 | |
| MA100: | 17,833.25 | |
| MAexp7: | 17,894.37 | |
| MAexp20: | 17,811.96 | |
| MAexp50: | 17,767.61 | |
| MAexp100: | 17,716.07 | |
| Price / MA7: | +1.61% | |
| Price / MA20: | +1.02% | |
| Price / MA50: | -0.80% | |
| Price / MA100: | +0.89% | |
| Price / MAexp7: | +0.54% | |
| Price / MAexp20: | +1.01% | |
| Price / MAexp50: | +1.26% | |
| Price / MAexp100: | +1.55% |
About author

Online


Add a comment
Comments
0 comments on the analysis NASDAQ100 - MINI NASDAQ100 FULL0624 - 15 min.