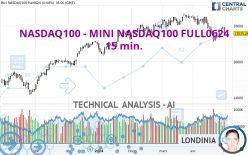
NASDAQ100 - MINI NASDAQ100 FULL0624 - 15 min. - Technical analysis published on 05/01/2024 (GMT)
- 71
- 0
Click here for a new analysis!
- Timeframe : 15 min.
- - Analysis generated on
- Status : INVALID

Summary of the analysis

Additional analysis
Quotes
The NASDAQ100 - MINI NASDAQ100 FULL0624 price is 17,481.75 USD. The price registered a decrease of -0.51% on the session with the lowest point at 17,399.25 USD and the highest point at 17,529.25 USD. The deviation from the price is +0.47% for the low point and -0.27% for the high point.The Central Gaps scanner detects the formation of a bearish gap marking the strong presence of sellers ahead of buyers at the opening. This formed a quotation gap.
Opening Gap DOWN
Type : Bearish
Timeframe : Openning
A study of price movements over other periods shows the following variations:
Near a new HIGH record (5 years)
Type : Bullish
Timeframe : Weekly
Near a new LOW record (1st january)
Type : Bearish
Timeframe : Weekly
Near a new LOW record (1 month)
Type : Bearish
Timeframe : Weekly
Technical
Technical analysis of this 15 min. chart of NASDAQ100 - MINI NASDAQ100 FULL0624 indicates that the overall trend is bearish. The signals given by moving averages are at 67.86% bearish. This bearish trend could slow down given the slightly bullish signals currently being given by short-term moving averages. An assessment of moving averages reveals several bullish signals that could impact this trend:
Bullish price crossover with Moving Average 20
Type : Bullish
Timeframe : 15 minutes
Bullish price crossover with Moving Average 50
Type : Bullish
Timeframe : 15 minutes
Bullish price crossover with adaptative moving average 20
Type : Bullish
Timeframe : 15 minutes
In fact, of the 18 technical indicators analysed by Central Analyzer, 8 are bullish, 6 are neutral and 4 are bearish. Caution: the Central Indicators scanner currently detects an excess:
CCI indicator is overbought : over 100
Type : Neutral
Timeframe : 15 minutes
Williams %R indicator is overbought : over -20
Type : Neutral
Timeframe : 15 minutes
Aroon indicator bullish trend
Type : Bullish
Timeframe : 15 minutes
Ichimoku : price is over the cloud
Type : Bullish
Timeframe : 15 minutes
Price is back under the pivot point
Type : Bearish
Timeframe : Weekly
Momentum indicator is back over 0
Type : Bullish
Timeframe : 15 minutes
Central Patterns, the scanner specializing in chart patterns, did not identify any signals.
The Central Candlesticks scanner which studies Japanese candlesticks did not detect anything.
| S3 | S2 | S1 | Price | R1 | R2 | R3 | |
|---|---|---|---|---|---|---|---|
| ProTrendLines | 17,180.75 | 17,307.94 | 17,448.00 | 17,481.75 | 17,553.00 | 17,668.00 | 17,767.10 |
| Change (%) | -1.72% | -0.99% | -0.19% | - | +0.41% | +1.07% | +1.63% |
| Change | -301.00 | -173.81 | -33.75 | - | +71.25 | +186.25 | +285.35 |
| Level | Major | Intermediate | Minor | - | Minor | Minor | Major |
Attention could also be paid to pivot points to set price objectives:
| Pivot points | S3 | S2 | S1 | PP | R1 | R2 | R3 |
|---|---|---|---|---|---|---|---|
| Standard | 16,943.00 | 17,208.25 | 17,389.75 | 17,655.00 | 17,836.50 | 18,101.75 | 18,283.25 |
| Camarilla | 17,448.39 | 17,489.35 | 17,530.30 | 17,571.25 | 17,612.20 | 17,653.15 | 17,694.11 |
| Woodie | 16,901.13 | 17,187.31 | 17,347.88 | 17,634.06 | 17,794.63 | 18,080.81 | 18,241.38 |
| Fibonacci | 17,208.25 | 17,378.91 | 17,484.34 | 17,655.00 | 17,825.66 | 17,931.09 | 18,101.75 |
| Pivot points | S3 | S2 | S1 | PP | R1 | R2 | R3 |
|---|---|---|---|---|---|---|---|
| Standard | 16,609.33 | 16,878.92 | 17,362.33 | 17,631.92 | 18,115.33 | 18,384.92 | 18,868.33 |
| Camarilla | 17,638.68 | 17,707.70 | 17,776.73 | 17,845.75 | 17,914.78 | 17,983.80 | 18,052.83 |
| Woodie | 16,716.25 | 16,932.38 | 17,469.25 | 17,685.38 | 18,222.25 | 18,438.38 | 18,975.25 |
| Fibonacci | 16,878.92 | 17,166.56 | 17,344.27 | 17,631.92 | 17,919.56 | 18,097.27 | 18,384.92 |
| Pivot points | S3 | S2 | S1 | PP | R1 | R2 | R3 |
|---|---|---|---|---|---|---|---|
| Standard | 17,396.58 | 17,701.42 | 18,099.33 | 18,404.17 | 18,802.08 | 19,106.92 | 19,504.83 |
| Camarilla | 18,303.99 | 18,368.41 | 18,432.83 | 18,497.25 | 18,561.67 | 18,626.09 | 18,690.51 |
| Woodie | 17,443.13 | 17,724.69 | 18,145.88 | 18,427.44 | 18,848.63 | 19,130.19 | 19,551.38 |
| Fibonacci | 17,701.42 | 17,969.87 | 18,135.72 | 18,404.17 | 18,672.62 | 18,838.47 | 19,106.92 |
Numerical data
The following is the status of technical indicators and moving averages registered at the time this technical analysis was created:
| RSI (14): | 51.50 | |
| MACD (12,26,9): | -7.0900 | |
| Directional Movement: | -7.94 | |
| AROON (14): | -35.71 | |
| DEMA (21): | 17,447.10 | |
| Parabolic SAR (0,02-0,02-0,2): | 17,400.75 | |
| Elder Ray (13): | 7.39 | |
| Super Trend (3,10): | 17,538.38 | |
| Zig ZAG (10): | 17,463.00 | |
| VORTEX (21): | 0.9800 | |
| Stochastique (14,3,5): | 54.52 | |
| TEMA (21): | 17,462.03 | |
| Williams %R (14): | -10.68 | |
| Chande Momentum Oscillator (20): | 45.25 | |
| Repulse (5,40,3): | -0.0900 | |
| ROCnROLL: | -1 | |
| TRIX (15,9): | 0.0000 | |
| Courbe Coppock: | 0.26 |
| MA7: | 17,663.86 | |
| MA20: | 17,851.96 | |
| MA50: | 18,147.38 | |
| MA100: | 17,813.06 | |
| MAexp7: | 17,464.34 | |
| MAexp20: | 17,454.86 | |
| MAexp50: | 17,475.95 | |
| MAexp100: | 17,537.17 | |
| Price / MA7: | -1.03% | |
| Price / MA20: | -2.07% | |
| Price / MA50: | -3.67% | |
| Price / MA100: | -1.86% | |
| Price / MAexp7: | +0.10% | |
| Price / MAexp20: | +0.15% | |
| Price / MAexp50: | +0.03% | |
| Price / MAexp100: | -0.32% |
About author

Online


Add a comment
Comments
0 comments on the analysis NASDAQ100 - MINI NASDAQ100 FULL0624 - 15 min.