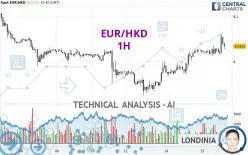
EUR/HKD - 1H - Technical analysis published on 01/15/2025 (GMT)
- 123
- 0
Click here for a new analysis!
- Timeframe : 1H
- - Analysis generated on
- Status : LEVEL MAINTAINED

Summary of the analysis

Additional analysis
Quotes
The EUR/HKD price is 8.0343 HKD. The price has increased by +0.11% since the last closing and was traded between 8.0126 HKD and 8.0616 HKD over the period. The price is currently at +0.27% from its lowest and -0.34% from its highest.The Central Gaps scanner detects a bullish opening marking the presence of buyers ahead of sellers at the opening but not sufficiently marked to allow the price to register a quotation gap.
Bullish opening
Type : Bullish
Timeframe : Openning
Here is a more detailed summary of the historical variations registered by EUR/HKD:
Near a new LOW record (1 year)
Type : Bearish
Timeframe : Weekly
Near a new LOW record (1st january)
Type : Bearish
Timeframe : Weekly
Near a new HIGH record (1 month)
Type : Bullish
Timeframe : Weekly
Technical
Technical analysis of this 1H chart of EUR/HKD indicates that the overall trend is strongly bullish. 92.86% of the signals given by moving averages are bullish. This strongly bullish trend is supported by the strong bullish signals given by short-term moving averages. There is no crossing of moving average by the price or crossing of moving averages between themselves.
In fact, only 8 technical indicators out of 18 studied are currently positioned bullish. But beware of excesses. The Central Indicators scanner currently detects this:
CCI indicator is overbought : over 100
Type : Neutral
Timeframe : 1 hour
MACD indicator: bearish divergence
Type : Bearish
Timeframe : 1 hour
Price is back over the pivot point
Type : Bullish
Timeframe : Weekly
Williams %R indicator is back under -50
Type : Bearish
Timeframe : 1 hour
An analysis of the price chart with the Central Patterns scanner (detector of chart patterns and resistances and supports) shows several results that can have an impact on the price change:
Near horizontal resistance
Type : Bearish
Timeframe : 1 hour
Resistance of channel is broken
Type : Bullish
Timeframe : 1 hour
The presence of a bullish Japanese candlestick pattern detected by Central Candlesticks that could cause a very short term rebound was also detected:
Bullish harami
Type : Bullish
Timeframe : 1 hour
| S3 | S2 | S1 | Price | R1 | R2 | R3 | |
|---|---|---|---|---|---|---|---|
| ProTrendLines | 7.9727 | 8.0009 | 8.0281 | 8.0343 | 8.0650 | 8.0811 | 8.1095 |
| Change (%) | -0.77% | -0.42% | -0.08% | - | +0.38% | +0.58% | +0.94% |
| Change | -0.0616 | -0.0334 | -0.0062 | - | +0.0307 | +0.0468 | +0.0752 |
| Level | Minor | Major | Major | - | Minor | Minor | Intermediate |
To determine price objectives, it is also possible to use the pivot points. Here is the price position in relation to pivot points:
| Pivot points | S3 | S2 | S1 | PP | R1 | R2 | R3 |
|---|---|---|---|---|---|---|---|
| Standard | 7.9287 | 7.9490 | 7.9871 | 8.0074 | 8.0455 | 8.0658 | 8.1039 |
| Camarilla | 8.0091 | 8.0145 | 8.0199 | 8.0252 | 8.0306 | 8.0359 | 8.0413 |
| Woodie | 7.9376 | 7.9535 | 7.9960 | 8.0119 | 8.0544 | 8.0703 | 8.1128 |
| Fibonacci | 7.9490 | 7.9713 | 7.9851 | 8.0074 | 8.0297 | 8.0435 | 8.0658 |
| Pivot points | S3 | S2 | S1 | PP | R1 | R2 | R3 |
|---|---|---|---|---|---|---|---|
| Standard | 7.7567 | 7.8546 | 7.9164 | 8.0143 | 8.0761 | 8.1740 | 8.2358 |
| Camarilla | 7.9344 | 7.9490 | 7.9637 | 7.9783 | 7.9929 | 8.0076 | 8.0222 |
| Woodie | 7.7388 | 7.8456 | 7.8985 | 8.0053 | 8.0582 | 8.1650 | 8.2179 |
| Fibonacci | 7.8546 | 7.9156 | 7.9533 | 8.0143 | 8.0753 | 8.1130 | 8.1740 |
| Pivot points | S3 | S2 | S1 | PP | R1 | R2 | R3 |
|---|---|---|---|---|---|---|---|
| Standard | 7.7291 | 7.8821 | 7.9623 | 8.1153 | 8.1955 | 8.3485 | 8.4287 |
| Camarilla | 7.9784 | 7.9998 | 8.0211 | 8.0425 | 8.0639 | 8.0853 | 8.1066 |
| Woodie | 7.6927 | 7.8639 | 7.9259 | 8.0971 | 8.1591 | 8.3303 | 8.3923 |
| Fibonacci | 7.8821 | 7.9712 | 8.0262 | 8.1153 | 8.2044 | 8.2594 | 8.3485 |
Numerical data
The following is the status of the technical indicators and moving averages at the time of publication of this technical analysis:
| RSI (14): | 55.91 | |
| MACD (12,26,9): | 0.0094 | |
| Directional Movement: | 16.9029 | |
| AROON (14): | 42.8572 | |
| DEMA (21): | 8.0376 | |
| Parabolic SAR (0,02-0,02-0,2): | 8.0159 | |
| Elder Ray (13): | 0.0046 | |
| Super Trend (3,10): | 8.0049 | |
| Zig ZAG (10): | 8.0386 | |
| VORTEX (21): | 1.0794 | |
| Stochastique (14,3,5): | 63.13 | |
| TEMA (21): | 8.0380 | |
| Williams %R (14): | -51.63 | |
| Chande Momentum Oscillator (20): | 0.0113 | |
| Repulse (5,40,3): | 0.0210 | |
| ROCnROLL: | 1 | |
| TRIX (15,9): | 0.0182 | |
| Courbe Coppock: | 0.27 |
| MA7: | 8.0162 | |
| MA20: | 8.0510 | |
| MA50: | 8.1545 | |
| MA100: | 8.3567 | |
| MAexp7: | 8.0342 | |
| MAexp20: | 8.0238 | |
| MAexp50: | 8.0083 | |
| MAexp100: | 8.0042 | |
| Price / MA7: | +0.23% | |
| Price / MA20: | -0.21% | |
| Price / MA50: | -1.47% | |
| Price / MA100: | -3.86% | |
| Price / MAexp7: | +0.00% | |
| Price / MAexp20: | +0.13% | |
| Price / MAexp50: | +0.32% | |
| Price / MAexp100: | +0.38% |
About author

Online


Add a comment
Comments
0 comments on the analysis EUR/HKD - 1H