EUR/HKD - 1H - Technical analysis published on 03/13/2024 (GMT)
- 103
- 0
- Timeframe : 1H
- - Analysis generated on
- Status : NEUTRAL

Summary of the analysis

Additional analysis
Quotes
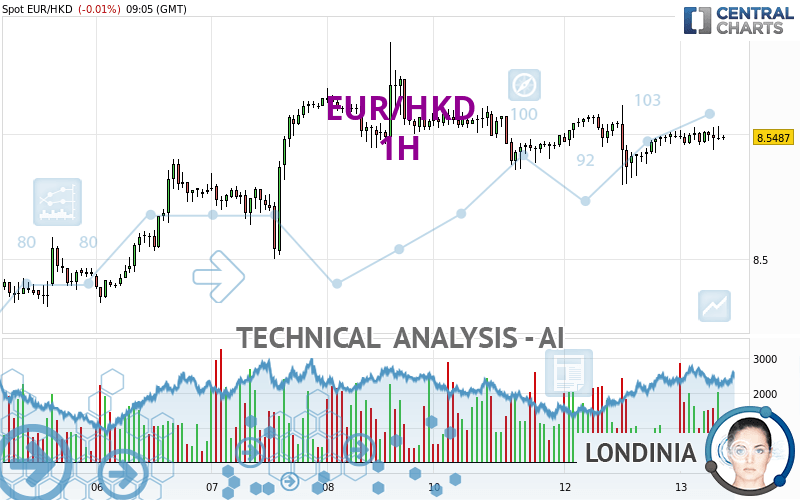
The EUR/HKD price is 8.5487 HKD. On the day, this instrument lost -0.01% and was traded between 8.5438 HKD and 8.5532 HKD over the period. The price is currently at +0.06% from its lowest and -0.05% from its highest.A bullish opening was detected by the Central Gaps scanner. Buyers are trying to impose a bullish momentum in the very short term.
Bullish opening
Type : Bullish
Timeframe : Openning
A study of price movements over other periods shows the following variations:
Near a new LOW record (1 year)
Type : Bearish
Timeframe : Weekly
Near a new LOW record (1st january)
Type : Bearish
Timeframe : Weekly
Near a new LOW record (1 month)
Type : Bearish
Timeframe : Weekly
Technical
Technical analysis of EUR/HKD in 1H shows an overall slightly bullish trend. 57.14% of the signals given by moving averages are bullish. As the signals currently given by short-term moving averages are rather neutral, the overall trend could quickly return to neutral as well. The Central Indicators market scanner is currently detecting several bullish signals that could impact this trend:
Bullish trend reversal : Moving Average 20
Type : Bullish
Timeframe : 1 hour
Bullish price crossover with Moving Average 50
Type : Bullish
Timeframe : 1 hour
Bullish price crossover with Moving Average 100
Type : Bullish
Timeframe : 1 hour
Bullish price crossover with adaptative moving average 20
Type : Bullish
Timeframe : 1 hour
Bullish price crossover with adaptative moving average 50
Type : Bullish
Timeframe : 1 hour
In fact, 10 technical indicators on 18 studied are currently bullish. But beware of excesses. The Central Indicators scanner currently detects this:
Williams %R indicator is overbought : over -20
Type : Neutral
Timeframe : 1 hour
The Central Patterns scanner, which studies chart patterns, resistances and supports, has identified these signals:
Near resistance of channel
Type : Bearish
Timeframe : 1 hour
Near resistance of triangle
Type : Bearish
Timeframe : 1 hour
The Central Candlesticks scanner which studies Japanese candlesticks did not detect anything.
| S3 | S2 | S1 | Price | R1 | R2 | R3 | |
|---|---|---|---|---|---|---|---|
| ProTrendLines | 8.4899 | 8.5003 | 8.5297 | 8.5487 | 8.5490 | 8.5613 | 8.5768 |
| Change (%) | -0.69% | -0.57% | -0.22% | - | +0.00% | +0.15% | +0.33% |
| Change | -0.0588 | -0.0484 | -0.0190 | - | +0.0003 | +0.0126 | +0.0281 |
| Level | Major | Minor | Minor | - | Minor | Major | Major |
To determine price objectives, it is also possible to use the pivot points. Here is the price position in relation to pivot points:
| Pivot points | S3 | S2 | S1 | PP | R1 | R2 | R3 |
|---|---|---|---|---|---|---|---|
| Standard | 8.5006 | 8.5153 | 8.5322 | 8.5469 | 8.5638 | 8.5785 | 8.5954 |
| Camarilla | 8.5405 | 8.5434 | 8.5463 | 8.5492 | 8.5521 | 8.5550 | 8.5579 |
| Woodie | 8.5018 | 8.5159 | 8.5334 | 8.5475 | 8.5650 | 8.5791 | 8.5966 |
| Fibonacci | 8.5153 | 8.5273 | 8.5348 | 8.5469 | 8.5589 | 8.5664 | 8.5785 |
| Pivot points | S3 | S2 | S1 | PP | R1 | R2 | R3 |
|---|---|---|---|---|---|---|---|
| Standard | 8.3895 | 8.4353 | 8.4953 | 8.5411 | 8.6011 | 8.6469 | 8.7069 |
| Camarilla | 8.5263 | 8.5360 | 8.5457 | 8.5554 | 8.5651 | 8.5748 | 8.5845 |
| Woodie | 8.3967 | 8.4389 | 8.5025 | 8.5447 | 8.6083 | 8.6505 | 8.7141 |
| Fibonacci | 8.4353 | 8.4757 | 8.5007 | 8.5411 | 8.5815 | 8.6065 | 8.6469 |
| Pivot points | S3 | S2 | S1 | PP | R1 | R2 | R3 |
|---|---|---|---|---|---|---|---|
| Standard | 8.2129 | 8.2871 | 8.3732 | 8.4474 | 8.5335 | 8.6077 | 8.6938 |
| Camarilla | 8.4153 | 8.4300 | 8.4447 | 8.4594 | 8.4741 | 8.4888 | 8.5035 |
| Woodie | 8.2190 | 8.2901 | 8.3793 | 8.4504 | 8.5396 | 8.6107 | 8.6999 |
| Fibonacci | 8.2871 | 8.3483 | 8.3861 | 8.4474 | 8.5086 | 8.5464 | 8.6077 |
Numerical data
The following is the status of the technical indicators and moving averages at the time of publication of this technical analysis:
| RSI (14): | 54.87 | |
| MACD (12,26,9): | 0.0004 | |
| Directional Movement: | -8.1857 | |
| AROON (14): | 100.0000 | |
| DEMA (21): | 8.5488 | |
| Parabolic SAR (0,02-0,02-0,2): | 8.5394 | |
| Elder Ray (13): | 0.0016 | |
| Super Trend (3,10): | 8.5632 | |
| Zig ZAG (10): | 8.5508 | |
| VORTEX (21): | 0.9694 | |
| Stochastique (14,3,5): | 73.82 | |
| TEMA (21): | 8.5498 | |
| Williams %R (14): | -19.63 | |
| Chande Momentum Oscillator (20): | 0.0024 | |
| Repulse (5,40,3): | 0.0357 | |
| ROCnROLL: | 1 | |
| TRIX (15,9): | -0.0003 | |
| Courbe Coppock: | 0.11 |
| MA7: | 8.5417 | |
| MA20: | 8.4909 | |
| MA50: | 8.4888 | |
| MA100: | 8.4744 | |
| MAexp7: | 8.5495 | |
| MAexp20: | 8.5488 | |
| MAexp50: | 8.5486 | |
| MAexp100: | 8.5429 | |
| Price / MA7: | +0.08% | |
| Price / MA20: | +0.68% | |
| Price / MA50: | +0.71% | |
| Price / MA100: | +0.88% | |
| Price / MAexp7: | -0.01% | |
| Price / MAexp20: | +0.00% | |
| Price / MAexp50: | +0.00% | |
| Price / MAexp100: | +0.07% |
About author
Online


Add a comment
Comments
0 comments on the analysis EUR/HKD - 1H