STOXX50 FULL0325 - Daily - Technical analysis published on 12/01/2021 (GMT)
- 278
- 0
- Timeframe : Daily
- - Analysis generated on
- Status : NEUTRAL

Summary of the analysis

Additional analysis
Quotes
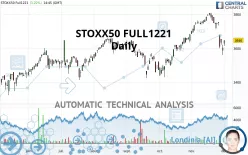
The STOXX50 FULL1221 rating is 3,646.00 EUR. The price has increased by +1.22% since the last closing and was traded between 3,614.00 EUR and 3,647.00 EUR over the period. The price is currently at +0.89% from its lowest and -0.03% from its highest.The Central Gaps scanner detects the formation of a bullish gap marking the strong presence of buyers against sellers at the opening. This formed a quotation gap.
Opening Gap UP
Type : Bullish
Timeframe : Openning
So that you have an overall view of the price change, here is a table showing the variations over several periods:
Near a new HIGH record (5 years)
Type : Bullish
Timeframe : Weekly
Near a new HIGH record (1st january)
Type : Bullish
Timeframe : Weekly
Technical
A technical analysis in Daily of this STOXX50 FULL1221 chart shows a slightly bullish trend. 60.71% of the signals given by moving averages are bullish. Caution: the slightly bearish signals currently given by short-term moving averages indicate that the overall trend could be reversed. An assessment of moving averages reveals a bearish signal that could impact this trend:
Bearish price crossover with adaptative moving average 100
Type : Bearish
Timeframe : Daily
An assessment of technical indicators does not currently provide any relevant information to suggest whether the signal given by the technical indicators is more bullish or bearish.
Caution: the Central Indicators scanner currently detects an excess:
CCI indicator is oversold : under -100
Type : Neutral
Timeframe : Daily
Williams %R indicator is oversold : under -80
Type : Neutral
Timeframe : Daily
Pivot points : price is over resistance 1
Type : Neutral
Timeframe : Daily
Ichimoku - Bearish crossover : Tenkan & Kijun
Type : Bearish
Timeframe : Daily
The analysis of the price chart with Central Patterns scanners does not return any result.
The Central Candlesticks scanner, specialised in Japanese candlesticks, did not identify any signals.
| S3 | S2 | S1 | Price | R1 | R2 | R3 | |
|---|---|---|---|---|---|---|---|
| ProTrendLines | 3,294.00 | 3,445.90 | 3,553.56 | 3,646.00 | 3,654.20 | 3,748.40 | 3,805.00 |
| Change (%) | -9.65% | -5.49% | -2.54% | - | +0.22% | +2.81% | +4.36% |
| Change | -352.00 | -200.10 | -92.44 | - | +8.20 | +102.40 | +159.00 |
| Level | Minor | Major | Major | - | Major | Minor | Minor |
Attention could also be paid to pivot points to set price objectives:
| Pivot points | S3 | S2 | S1 | PP | R1 | R2 | R3 |
|---|---|---|---|---|---|---|---|
| Standard | 3,507.00 | 3,534.00 | 3,568.00 | 3,595.00 | 3,629.00 | 3,656.00 | 3,690.00 |
| Camarilla | 3,585.23 | 3,590.82 | 3,596.41 | 3,602.00 | 3,607.59 | 3,613.18 | 3,618.78 |
| Woodie | 3,510.50 | 3,535.75 | 3,571.50 | 3,596.75 | 3,632.50 | 3,657.75 | 3,693.50 |
| Fibonacci | 3,534.00 | 3,557.30 | 3,571.70 | 3,595.00 | 3,618.30 | 3,632.70 | 3,656.00 |
| Pivot points | S3 | S2 | S1 | PP | R1 | R2 | R3 |
|---|---|---|---|---|---|---|---|
| Standard | 3,362.67 | 3,481.33 | 3,545.67 | 3,664.33 | 3,728.67 | 3,847.33 | 3,911.67 |
| Camarilla | 3,559.68 | 3,576.45 | 3,593.23 | 3,610.00 | 3,626.78 | 3,643.55 | 3,660.33 |
| Woodie | 3,335.50 | 3,467.75 | 3,518.50 | 3,650.75 | 3,701.50 | 3,833.75 | 3,884.50 |
| Fibonacci | 3,481.33 | 3,551.24 | 3,594.43 | 3,664.33 | 3,734.24 | 3,777.43 | 3,847.33 |
| Pivot points | S3 | S2 | S1 | PP | R1 | R2 | R3 |
|---|---|---|---|---|---|---|---|
| Standard | 3,260.33 | 3,410.67 | 3,506.33 | 3,656.67 | 3,752.33 | 3,902.67 | 3,998.33 |
| Camarilla | 3,534.35 | 3,556.90 | 3,579.45 | 3,602.00 | 3,624.55 | 3,647.10 | 3,669.65 |
| Woodie | 3,233.00 | 3,397.00 | 3,479.00 | 3,643.00 | 3,725.00 | 3,889.00 | 3,971.00 |
| Fibonacci | 3,410.67 | 3,504.64 | 3,562.70 | 3,656.67 | 3,750.64 | 3,808.70 | 3,902.67 |
Numerical data
The following is the status of the technical indicators and moving averages at the time of publication of this technical analysis:
| RSI (14): | 41.68 | |
| MACD (12,26,9): | -4.2300 | |
| Directional Movement: | -24.20 | |
| AROON (14): | -64.29 | |
| DEMA (21): | 3,706.75 | |
| Parabolic SAR (0,02-0,02-0,2): | 3,727.70 | |
| Elder Ray (13): | -62.15 | |
| Super Trend (3,10): | 3,717.48 | |
| Zig ZAG (10): | 3,644.00 | |
| VORTEX (21): | 0.9000 | |
| Stochastique (14,3,5): | 21.15 | |
| TEMA (21): | 3,671.22 | |
| Williams %R (14): | -66.26 | |
| Chande Momentum Oscillator (20): | -142.00 | |
| Repulse (5,40,3): | 0.2600 | |
| ROCnROLL: | 2 | |
| TRIX (15,9): | 0.0900 | |
| Courbe Coppock: | 4.47 |
| MA7: | 3,675.43 | |
| MA20: | 3,734.05 | |
| MA50: | 3,640.80 | |
| MA100: | 3,603.01 | |
| MAexp7: | 3,665.96 | |
| MAexp20: | 3,698.47 | |
| MAexp50: | 3,663.28 | |
| MAexp100: | 3,600.80 | |
| Price / MA7: | -0.80% | |
| Price / MA20: | -2.36% | |
| Price / MA50: | +0.14% | |
| Price / MA100: | +1.19% | |
| Price / MAexp7: | -0.54% | |
| Price / MAexp20: | -1.42% | |
| Price / MAexp50: | -0.47% | |
| Price / MAexp100: | +1.26% |
About author

Online


Add a comment
Comments
0 comments on the analysis STOXX50 FULL0325 - Daily