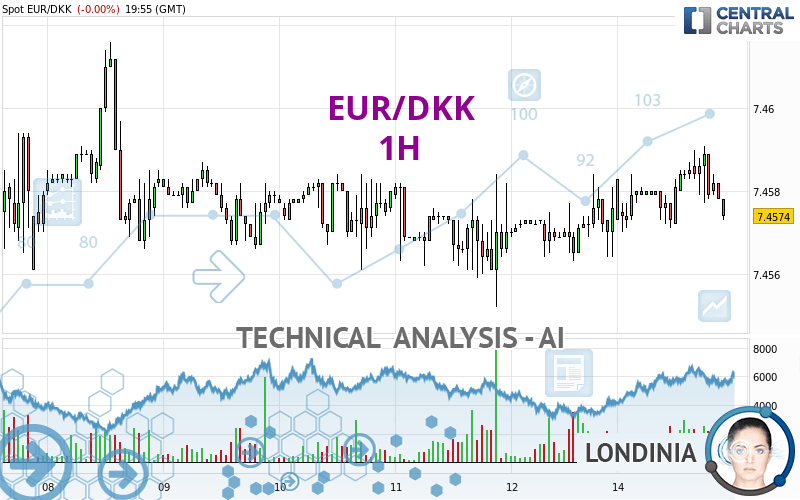
EUR/DKK - 1H - Technical analysis published on 01/15/2024 (GMT)
- 105
- 0
Click here for a new analysis!
- Timeframe : 1H
- - Analysis generated on
- Status : INVALID

Summary of the analysis

Additional analysis
Quotes
The EUR/DKK price is 7.4574 DKK. On the day, this instrument gained +0.00% with the lowest point at 7.4570 DKK and the highest point at 7.4591 DKK. The deviation from the price is +0.01% for the low point and -0.02% for the high point.The Central Gaps scanner detects a bearish opening marking the presence of sellers ahead of buyers at the opening but not sufficiently marked to allow the price to register a quotation gap.
Bearish opening
Type : Bearish
Timeframe : Openning
So that you have an overall view of the price change, here is a table showing the variations over several periods:
Near a new LOW record (5 years)
Type : Bearish
Timeframe : Weekly
Near a new HIGH record (1 year)
Type : Bullish
Timeframe : Weekly
Near a new HIGH record (1st january)
Type : Bullish
Timeframe : Weekly
Near a new HIGH record (1 month)
Type : Bullish
Timeframe : Weekly
Technical
Technical analysis of EUR/DKK in 1H shows an overall slightly bearish trend. 57.14% of the signals given by moving averages are bearish. This bearish trend does not seem to be increasing given the slightly bearish signals given by short-term moving averages. The Central Indicators market scanner is currently detecting several bearish signals that could impact this trend:
Bearish price crossover with Moving Average 50
Type : Bearish
Timeframe : 1 hour
Bearish price crossover with Moving Average 100
Type : Bearish
Timeframe : 1 hour
Bearish price crossover with adaptative moving average 20
Type : Bearish
Timeframe : 1 hour
Bearish price crossover with adaptative moving average 50
Type : Bearish
Timeframe : 1 hour
In fact, Central Analyzer took into account 18 technical indicators and the result was as follows: 5 are bullish, 6 are neutral and 7 are bearish. Caution: the Central Indicators scanner currently detects an excess:
CCI indicator is oversold : under -100
Type : Neutral
Timeframe : 1 hour
Williams %R indicator is oversold : under -80
Type : Neutral
Timeframe : 1 hour
Price is back under the pivot point
Type : Bearish
Timeframe : 1 hour
Momentum indicator is back under 0
Type : Bearish
Timeframe : 1 hour
An analysis of the price chart with the Central Patterns scanner (detector of chart patterns and resistances and supports) shows several results that can have an impact on the price change:
Near horizontal resistance
Type : Bearish
Timeframe : 1 hour
Near resistance of triangle
Type : Bearish
Timeframe : 1 hour
Resistance of channel is broken
Type : Bullish
Timeframe : 1 hour
The Central Candlesticks scanner, specialised in Japanese candlesticks, did not identify any signals.
| S3 | S2 | S1 | Price | R1 | R2 | R3 | |
|---|---|---|---|---|---|---|---|
| ProTrendLines | 7.4554 | 7.4561 | 7.4572 | 7.4574 | 7.4584 | 7.4593 | 7.4601 |
| Change (%) | -0.03% | -0.02% | +0.00% | - | +0.01% | +0.03% | +0.04% |
| Change | -0.0020 | -0.0013 | -0.0002 | - | +0.0010 | +0.0019 | +0.0027 |
| Level | Major | Major | Minor | - | Major | Major | Minor |
Attention could also be paid to pivot points to set price objectives:
| Pivot points | S3 | S2 | S1 | PP | R1 | R2 | R3 |
|---|---|---|---|---|---|---|---|
| Standard | 7.4544 | 7.4553 | 7.4565 | 7.4574 | 7.4586 | 7.4595 | 7.4607 |
| Camarilla | 7.4570 | 7.4572 | 7.4574 | 7.4576 | 7.4578 | 7.4580 | 7.4582 |
| Woodie | 7.4545 | 7.4554 | 7.4566 | 7.4575 | 7.4587 | 7.4596 | 7.4608 |
| Fibonacci | 7.4553 | 7.4561 | 7.4566 | 7.4574 | 7.4582 | 7.4587 | 7.4595 |
| Pivot points | S3 | S2 | S1 | PP | R1 | R2 | R3 |
|---|---|---|---|---|---|---|---|
| Standard | 7.4483 | 7.4517 | 7.4547 | 7.4581 | 7.4611 | 7.4645 | 7.4675 |
| Camarilla | 7.4558 | 7.4564 | 7.4570 | 7.4576 | 7.4582 | 7.4588 | 7.4594 |
| Woodie | 7.4480 | 7.4516 | 7.4544 | 7.4580 | 7.4608 | 7.4644 | 7.4672 |
| Fibonacci | 7.4517 | 7.4542 | 7.4557 | 7.4581 | 7.4606 | 7.4621 | 7.4645 |
| Pivot points | S3 | S2 | S1 | PP | R1 | R2 | R3 |
|---|---|---|---|---|---|---|---|
| Standard | 7.4257 | 7.4386 | 7.4464 | 7.4593 | 7.4671 | 7.4800 | 7.4878 |
| Camarilla | 7.4485 | 7.4504 | 7.4523 | 7.4542 | 7.4561 | 7.4580 | 7.4599 |
| Woodie | 7.4232 | 7.4373 | 7.4439 | 7.4580 | 7.4646 | 7.4787 | 7.4853 |
| Fibonacci | 7.4386 | 7.4465 | 7.4514 | 7.4593 | 7.4672 | 7.4721 | 7.4800 |
Numerical data
The following is the status of technical indicators and moving averages registered at the time this technical analysis was created:
| RSI (14): | 43.36 | |
| MACD (12,26,9): | 0.0001 | |
| Directional Movement: | 1.5644 | |
| AROON (14): | 50.0000 | |
| DEMA (21): | 7.4582 | |
| Parabolic SAR (0,02-0,02-0,2): | 7.4591 | |
| Elder Ray (13): | -0.0005 | |
| Super Trend (3,10): | 7.4569 | |
| Zig ZAG (10): | 7.4574 | |
| VORTEX (21): | 1.0246 | |
| Stochastique (14,3,5): | 35.00 | |
| TEMA (21): | 7.4582 | |
| Williams %R (14): | -85.00 | |
| Chande Momentum Oscillator (20): | -0.0003 | |
| Repulse (5,40,3): | -0.0119 | |
| ROCnROLL: | 2 | |
| TRIX (15,9): | 0.0005 | |
| Courbe Coppock: | 0.01 |
| MA7: | 7.4577 | |
| MA20: | 7.4564 | |
| MA50: | 7.4565 | |
| MA100: | 7.4573 | |
| MAexp7: | 7.4580 | |
| MAexp20: | 7.4580 | |
| MAexp50: | 7.4577 | |
| MAexp100: | 7.4576 | |
| Price / MA7: | +0.00% | |
| Price / MA20: | +0.01% | |
| Price / MA50: | +0.01% | |
| Price / MA100: | +0.00% | |
| Price / MAexp7: | -0.01% | |
| Price / MAexp20: | -0.01% | |
| Price / MAexp50: | +0.00% | |
| Price / MAexp100: | +0.00% |
About author
Online


Add a comment
Comments
0 comments on the analysis EUR/DKK - 1H