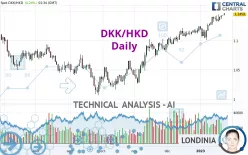
DKK/HKD - Daily - Technical analysis published on 01/23/2023 (GMT)
- 181
- 0
Click here for a new analysis!
- Timeframe : Daily
- - Analysis generated on
- Status : INVALID

Summary of the analysis

Additional analysis
Quotes
DKK/HKD rating 1.1459 HKD. The price registered an increase of +0.25% on the session and was between 1.1430 HKD and 1.1469 HKD. This implies that the price is at +0.25% from its lowest and at -0.09% from its highest.A bearish opening was detected by the Central Gaps scanner. Sellers are trying to impose a bearish trend in the very short term.
Bearish opening
Type : Bearish
Timeframe : Openning
A study of price movements over other periods shows the following variations:
New HIGH record (1st january)
Type : Bullish
Timeframe : Weekly
New HIGH record (1 month)
Type : Bullish
Timeframe : Weekly
Technical
Technical analysis of DKK/HKD in Daily shows a strongly overall bullish trend. 92.86% of the signals given by moving averages are bullish. The overall trend is supported by the strong bullish signals from short-term moving averages. The Central Indicators scanner does not detect any result on moving averages that would impact this trend.
In fact, 15 technical indicators on 18 studied are currently positioned bullish. Caution: the Central Indicators scanner currently detects an excess:
CCI indicator is overbought : over 100
Type : Neutral
Timeframe : Daily
Williams %R indicator is overbought : over -20
Type : Neutral
Timeframe : Daily
Pivot points : price is over resistance 3
Type : Neutral
Timeframe : Daily
An analysis of the price chart with the Central Patterns scanner (detector of chart patterns and resistances and supports) shows several results that can have an impact on the price change:
Near horizontal resistance
Type : Bearish
Timeframe : Daily
Near resistance of channel
Type : Bearish
Timeframe : Daily
For a small rebound in the very short term, the Central Candlesticks scanner currently notes the presence of this bullish pattern in Japanese candlesticks:
Bullish engulfing lines
Type : Bullish
Timeframe : Daily
| S3 | S2 | S1 | Price | R1 | R2 | R3 | |
|---|---|---|---|---|---|---|---|
| ProTrendLines | 1.0878 | 1.1052 | 1.1437 | 1.1459 | 1.1740 | 1.2545 | 1.2859 |
| Change (%) | -5.07% | -3.55% | -0.19% | - | +2.45% | +9.48% | +12.22% |
| Change | -0.0581 | -0.0407 | -0.0022 | - | +0.0281 | +0.1086 | +0.1400 |
| Level | Major | Intermediate | Major | - | Minor | Major | Intermediate |
To determine price objectives, it is also possible to use the pivot points. Here is the price position in relation to pivot points:
| Pivot points | S3 | S2 | S1 | PP | R1 | R2 | R3 |
|---|---|---|---|---|---|---|---|
| Standard | 1.1416 | 1.1420 | 1.1426 | 1.1430 | 1.1436 | 1.1440 | 1.1446 |
| Camarilla | 1.1428 | 1.1429 | 1.1430 | 1.1431 | 1.1432 | 1.1433 | 1.1434 |
| Woodie | 1.1416 | 1.1421 | 1.1426 | 1.1431 | 1.1436 | 1.1441 | 1.1446 |
| Fibonacci | 1.1420 | 1.1424 | 1.1427 | 1.1430 | 1.1434 | 1.1437 | 1.1440 |
| Pivot points | S3 | S2 | S1 | PP | R1 | R2 | R3 |
|---|---|---|---|---|---|---|---|
| Standard | 1.1223 | 1.1273 | 1.1347 | 1.1397 | 1.1471 | 1.1521 | 1.1595 |
| Camarilla | 1.1388 | 1.1399 | 1.1411 | 1.1422 | 1.1433 | 1.1445 | 1.1456 |
| Woodie | 1.1236 | 1.1279 | 1.1360 | 1.1403 | 1.1484 | 1.1527 | 1.1608 |
| Fibonacci | 1.1273 | 1.1320 | 1.1349 | 1.1397 | 1.1444 | 1.1473 | 1.1521 |
| Pivot points | S3 | S2 | S1 | PP | R1 | R2 | R3 |
|---|---|---|---|---|---|---|---|
| Standard | 1.0642 | 1.0763 | 1.1002 | 1.1123 | 1.1362 | 1.1483 | 1.1722 |
| Camarilla | 1.1143 | 1.1176 | 1.1209 | 1.1242 | 1.1275 | 1.1308 | 1.1341 |
| Woodie | 1.0702 | 1.0793 | 1.1062 | 1.1153 | 1.1422 | 1.1513 | 1.1782 |
| Fibonacci | 1.0763 | 1.0900 | 1.0985 | 1.1123 | 1.1260 | 1.1345 | 1.1483 |
Numerical data
The following are the details of the technical indicators and moving averages that were collected to generate this technical analysis:
| RSI (14): | 69.60 | |
| MACD (12,26,9): | 0.0100 | |
| Directional Movement: | 13.5458 | |
| AROON (14): | 85.7143 | |
| DEMA (21): | 1.1432 | |
| Parabolic SAR (0,02-0,02-0,2): | 1.1314 | |
| Elder Ray (13): | 0.0098 | |
| Super Trend (3,10): | 1.1208 | |
| Zig ZAG (10): | 1.1465 | |
| VORTEX (21): | 1.1564 | |
| Stochastique (14,3,5): | 96.87 | |
| TEMA (21): | 1.1445 | |
| Williams %R (14): | -0.22 | |
| Chande Momentum Oscillator (20): | 0.0296 | |
| Repulse (5,40,3): | 0.7303 | |
| ROCnROLL: | 1 | |
| TRIX (15,9): | 0.1162 | |
| Courbe Coppock: | 4.36 |
| MA7: | 1.1398 | |
| MA20: | 1.1281 | |
| MA50: | 1.1116 | |
| MA100: | 1.0787 | |
| MAexp7: | 1.1403 | |
| MAexp20: | 1.1301 | |
| MAexp50: | 1.1117 | |
| MAexp100: | 1.0975 | |
| Price / MA7: | +0.54% | |
| Price / MA20: | +1.58% | |
| Price / MA50: | +3.09% | |
| Price / MA100: | +6.23% | |
| Price / MAexp7: | +0.49% | |
| Price / MAexp20: | +1.40% | |
| Price / MAexp50: | +3.08% | |
| Price / MAexp100: | +4.41% |
About author
Online


Add a comment
Comments
0 comments on the analysis DKK/HKD - Daily