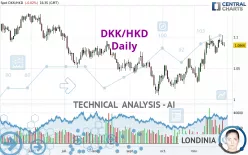
DKK/HKD - Daily - Technical analysis published on 11/29/2022 (GMT)
- 104
- 0
Click here for a new analysis!
- Timeframe : Daily
- - Analysis generated on
- Status : TARGET REACHED

Summary of the analysis

Additional analysis
Quotes
DKK/HKD rating 1.0866 HKD. On the day, this instrument lost -0.02% with the lowest point at 1.0844 HKD and the highest point at 1.0917 HKD. The deviation from the price is +0.20% for the low point and -0.47% for the high point.The Central Gaps scanner detects a bullish opening. A small advantage for buyers in the very short term.
Bullish opening
Type : Bullish
Timeframe : Openning
Here is a more detailed summary of the historical variations registered by DKK/HKD:
Near a new HIGH record (1 month)
Type : Bullish
Timeframe : Weekly
Technical
Technical analysis of DKK/HKD in Daily shows a strongly overall bullish trend. The signals given by the moving averages are 85.71% bullish. This strong bullish trend is confirmed by the strong signals currently being given by short-term moving averages. The Central Indicators scanner does not detect any result on moving averages that would impact this trend.
An assessment of technical indicators shows a moderate bullish signal.
Other results related to technical indicators were also found by the Central Indicators scanner:
MACD crosses DOWN its Moving Average
Type : Bearish
Timeframe : Daily
Momentum indicator is back under 0
Type : Bearish
Timeframe : Daily
An analysis of the price chart with the Central Patterns scanner (detector of chart patterns and resistances and supports) shows several results that can have an impact on the price change:
Near resistance of triangle
Type : Bearish
Timeframe : Daily
Near horizontal support
Type : Bullish
Timeframe : Daily
There is also a Japanese candlestick pattern detected by Central Candlesticks that could mark the end of the current short-term trend:
Doji
Type : Neutral
Timeframe : Daily
| S3 | S2 | S1 | Price | R1 | R2 | R3 | |
|---|---|---|---|---|---|---|---|
| ProTrendLines | 1.0129 | 1.0285 | 1.0579 | 1.0866 | 1.0878 | 1.1156 | 1.1365 |
| Change (%) | -6.78% | -5.35% | -2.64% | - | +0.11% | +2.67% | +4.59% |
| Change | -0.0737 | -0.0581 | -0.0287 | - | +0.0012 | +0.0290 | +0.0499 |
| Level | Intermediate | Intermediate | Intermediate | - | Major | Minor | Intermediate |
To determine price objectives, it is also possible to use the pivot points. Here is the price position in relation to pivot points:
| Pivot points | S3 | S2 | S1 | PP | R1 | R2 | R3 |
|---|---|---|---|---|---|---|---|
| Standard | 1.0637 | 1.0748 | 1.0808 | 1.0919 | 1.0979 | 1.1090 | 1.1150 |
| Camarilla | 1.0821 | 1.0837 | 1.0852 | 1.0868 | 1.0884 | 1.0899 | 1.0915 |
| Woodie | 1.0612 | 1.0735 | 1.0783 | 1.0906 | 1.0954 | 1.1077 | 1.1125 |
| Fibonacci | 1.0748 | 1.0813 | 1.0854 | 1.0919 | 1.0984 | 1.1025 | 1.1090 |
| Pivot points | S3 | S2 | S1 | PP | R1 | R2 | R3 |
|---|---|---|---|---|---|---|---|
| Standard | 1.0521 | 1.0623 | 1.0770 | 1.0872 | 1.1019 | 1.1121 | 1.1268 |
| Camarilla | 1.0850 | 1.0872 | 1.0895 | 1.0918 | 1.0941 | 1.0964 | 1.0987 |
| Woodie | 1.0545 | 1.0634 | 1.0794 | 1.0883 | 1.1043 | 1.1132 | 1.1292 |
| Fibonacci | 1.0623 | 1.0718 | 1.0777 | 1.0872 | 1.0967 | 1.1026 | 1.1121 |
| Pivot points | S3 | S2 | S1 | PP | R1 | R2 | R3 |
|---|---|---|---|---|---|---|---|
| Standard | 0.9685 | 0.9925 | 1.0173 | 1.0413 | 1.0661 | 1.0901 | 1.1149 |
| Camarilla | 1.0288 | 1.0333 | 1.0377 | 1.0422 | 1.0467 | 1.0512 | 1.0556 |
| Woodie | 0.9690 | 0.9927 | 1.0178 | 1.0415 | 1.0666 | 1.0903 | 1.1154 |
| Fibonacci | 0.9925 | 1.0111 | 1.0226 | 1.0413 | 1.0599 | 1.0714 | 1.0901 |
Numerical data
The following is the status of the technical indicators and moving averages at the time of publication of this technical analysis:
| RSI (14): | 58.19 | |
| MACD (12,26,9): | 0.0110 | |
| Directional Movement: | 15.7981 | |
| AROON (14): | 85.7142 | |
| DEMA (21): | 1.0920 | |
| Parabolic SAR (0,02-0,02-0,2): | 1.0748 | |
| Elder Ray (13): | 0.0047 | |
| Super Trend (3,10): | 1.0561 | |
| Zig ZAG (10): | 1.0861 | |
| VORTEX (21): | 1.1514 | |
| Stochastique (14,3,5): | 73.31 | |
| TEMA (21): | 1.0970 | |
| Williams %R (14): | -30.59 | |
| Chande Momentum Oscillator (20): | -0.0047 | |
| Repulse (5,40,3): | -0.8360 | |
| ROCnROLL: | 1 | |
| TRIX (15,9): | 0.1630 | |
| Courbe Coppock: | 5.54 |
| MA7: | 1.0874 | |
| MA20: | 1.0758 | |
| MA50: | 1.0519 | |
| MA100: | 1.0585 | |
| MAexp7: | 1.0876 | |
| MAexp20: | 1.0775 | |
| MAexp50: | 1.0647 | |
| MAexp100: | 1.0688 | |
| Price / MA7: | -0.07% | |
| Price / MA20: | +1.00% | |
| Price / MA50: | +3.30% | |
| Price / MA100: | +2.65% | |
| Price / MAexp7: | -0.09% | |
| Price / MAexp20: | +0.84% | |
| Price / MAexp50: | +2.06% | |
| Price / MAexp100: | +1.67% |
About author
Online


Add a comment
Comments
0 comments on the analysis DKK/HKD - Daily