| Open: | - |
| Change: | - |
| Volume: | - |
| Low: | - |
| High: | - |
| High / Low range: | - |
| Type: | Forex |
| Ticker: | DKKCZK |
| ISIN: |
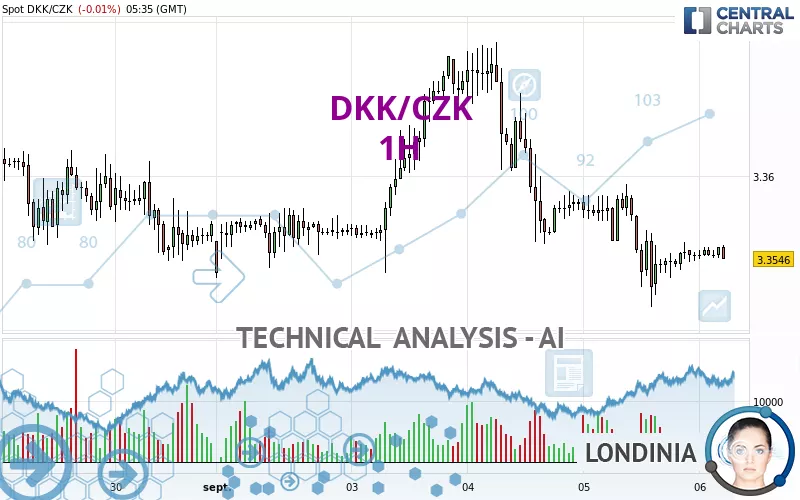
DKK/CZK - 1H - Technical analysis published on 09/06/2024 (GMT)
- 98
- 0
- 09/06/2024 - 05:35
Click here for a new analysis!
- Timeframe : 1H
- - Analysis generated on 09/06/2024 - 05:35
- Status : LEVEL MAINTAINED
Summary of the analysis

Additional analysis
Quotes
The DKK/CZK rating is 3.3546 CZK. The price is lower by -0.01% since the last closing with the lowest point at 3.3546 CZK and the highest point at 3.3555 CZK. The deviation from the price is 0% for the low point and -0.03% for the high point.The Central Gaps scanner detects a bearish opening. A small advantage for sellers in the very short term.
Bearish opening
Type : Bearish
Timeframe : Openning
A study of price movements over other periods shows the following variations:
Near a new HIGH record (1 year)
Type : Bullish
Timeframe : Weekly
Near a new HIGH record (1st january)
Type : Bullish
Timeframe : Weekly
Near a new HIGH record (1 month)
Type : Bullish
Timeframe : Weekly
Technical
Technical analysis of this 1H chart of DKK/CZK indicates that the overall trend is strongly bearish. 92.86% of the signals given by moving averages are bearish. This strongly bearish trend is supported by the strong bearish signals given by short-term moving averages. The Central Indicators market scanner currently does not detect any result that concerns moving averages.
The probability of a further increase is slight given the direction of the technical indicators.
Central Indicators, the scanner specialised in technical indicators, has identified this signal:
Price is back under the pivot point
Type : Bearish
Timeframe : 1 hour
Central Patterns, the market scanner focusing on chart patterns, resistances and supports found this result:
Near resistance of channel
Type : Bearish
Timeframe : 1 hour
The Central Candlesticks scanner which studies Japanese candlesticks did not detect anything.
| S3 | S2 | S1 | Price | R1 | R2 | R3 | |
|---|---|---|---|---|---|---|---|
| ProTrendLines | 3.3246 | 3.3385 | 3.3522 | 3.3546 | 3.3556 | 3.3595 | 3.3687 |
| Change (%) | -0.89% | -0.48% | -0.07% | - | +0.03% | +0.15% | +0.42% |
| Change | -0.0300 | -0.0161 | -0.0024 | - | +0.0010 | +0.0049 | +0.0141 |
| Level | Major | Minor | Major | - | Minor | Intermediate | Minor |
Pivot points can also be used to set your price objectives. Here is the price situation in relation to pivot points:
| Pivot points | S3 | S2 | S1 | PP | R1 | R2 | R3 |
|---|---|---|---|---|---|---|---|
| Standard | 3.3431 | 3.3473 | 3.3511 | 3.3553 | 3.3591 | 3.3633 | 3.3671 |
| Camarilla | 3.3527 | 3.3534 | 3.3542 | 3.3549 | 3.3556 | 3.3564 | 3.3571 |
| Woodie | 3.3429 | 3.3472 | 3.3509 | 3.3552 | 3.3589 | 3.3632 | 3.3669 |
| Fibonacci | 3.3473 | 3.3504 | 3.3522 | 3.3553 | 3.3584 | 3.3602 | 3.3633 |
| Pivot points | S3 | S2 | S1 | PP | R1 | R2 | R3 |
|---|---|---|---|---|---|---|---|
| Standard | 3.3234 | 3.3366 | 3.3468 | 3.3600 | 3.3702 | 3.3834 | 3.3936 |
| Camarilla | 3.3505 | 3.3526 | 3.3548 | 3.3569 | 3.3591 | 3.3612 | 3.3633 |
| Woodie | 3.3218 | 3.3359 | 3.3452 | 3.3593 | 3.3686 | 3.3827 | 3.3920 |
| Fibonacci | 3.3366 | 3.3456 | 3.3511 | 3.3600 | 3.3690 | 3.3745 | 3.3834 |
| Pivot points | S3 | S2 | S1 | PP | R1 | R2 | R3 |
|---|---|---|---|---|---|---|---|
| Standard | 3.2583 | 3.3041 | 3.3305 | 3.3763 | 3.4027 | 3.4485 | 3.4749 |
| Camarilla | 3.3371 | 3.3437 | 3.3503 | 3.3569 | 3.3635 | 3.3701 | 3.3768 |
| Woodie | 3.2486 | 3.2993 | 3.3208 | 3.3715 | 3.3930 | 3.4437 | 3.4652 |
| Fibonacci | 3.3041 | 3.3317 | 3.3487 | 3.3763 | 3.4039 | 3.4209 | 3.4485 |
Numerical data
The following is the status of technical indicators and moving averages registered at the time this technical analysis was created:
| RSI (14): | 46.30 | |
| MACD (12,26,9): | -0.0007 | |
| Directional Movement: | -4.4154 | |
| AROON (14): | 42.8571 | |
| DEMA (21): | 3.3544 | |
| Parabolic SAR (0,02-0,02-0,2): | 3.3518 | |
| Elder Ray (13): | 0.0003 | |
| Super Trend (3,10): | 3.3586 | |
| Zig ZAG (10): | 3.3551 | |
| VORTEX (21): | 0.9105 | |
| Stochastique (14,3,5): | 77.19 | |
| TEMA (21): | 3.3547 | |
| Williams %R (14): | -26.09 | |
| Chande Momentum Oscillator (20): | 0.0005 | |
| Repulse (5,40,3): | -0.0075 | |
| ROCnROLL: | 2 | |
| TRIX (15,9): | -0.0042 | |
| Courbe Coppock: | 0.01 |
| MA7: | 3.3580 | |
| MA20: | 3.3636 | |
| MA50: | 3.3796 | |
| MA100: | 3.3558 | |
| MAexp7: | 3.3551 | |
| MAexp20: | 3.3554 | |
| MAexp50: | 3.3570 | |
| MAexp100: | 3.3579 | |
| Price / MA7: | -0.10% | |
| Price / MA20: | -0.27% | |
| Price / MA50: | -0.74% | |
| Price / MA100: | -0.04% | |
| Price / MAexp7: | -0.01% | |
| Price / MAexp20: | -0.02% | |
| Price / MAexp50: | -0.07% | |
| Price / MAexp100: | -0.10% |
About author
Online


Add a comment
Comments
0 comments on the analysis DKK/CZK - 1H