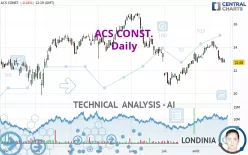
ACS CONST. - Daily - Technical analysis published on 08/26/2022 (GMT)
- 219
- 0
Click here for a new analysis!
- Timeframe : Daily
- - Analysis generated on
- Status : TARGET REACHED

Summary of the analysis

Additional analysis
Quotes
ACS CONST. rating 22.68 EUR. The price registered a decrease of -0.04% on the session and was between 22.68 EUR and 23.00 EUR. This implies that the price is at 0% from its lowest and at -1.39% from its highest.The Central Gaps scanner detects a bullish opening marking the presence of buyers ahead of sellers at the opening but not sufficiently marked to allow the price to register a quotation gap.
Bullish opening
Type : Bullish
Timeframe : Openning
So that you have an overall view of the price change, here is a table showing the variations over several periods:
Near a new LOW record (1 month)
Type : Bearish
Timeframe : Weekly
Technical
A technical analysis in Daily of this ACS CONST. chart shows a slightly bearish trend. 57.14% of the signals given by moving averages are bearish. The overall trend remains fragile, reflecting the slightly bearish signals given by short-term moving averages. The Central Indicators scanner detects a bearish signal on moving averages that could impact this trend:
Bearish trend reversal : adaptative moving average 100
Type : Bearish
Timeframe : Daily
An assessment of technical indicators shows a bearish signal.
Caution: the Central Indicators scanner currently detects an excess:
Williams %R indicator is oversold : under -80
Type : Neutral
Timeframe : Daily
Pivot points : price is under support 3
Type : Neutral
Timeframe : Weekly
Price is back under the pivot point
Type : Bearish
Timeframe : Daily
An analysis of the price chart with the Central Patterns scanner (detector of chart patterns and resistances and supports) shows several results that can have an impact on the price change:
Near horizontal support
Type : Bullish
Timeframe : Daily
Support of channel is broken
Type : Bearish
Timeframe : Daily
No result was found by the Central Candlesticks scanner on Japanese candlesticks.
| S3 | S2 | S1 | Price | R1 | R2 | R3 | |
|---|---|---|---|---|---|---|---|
| ProTrendLines | 21.37 | 22.11 | 22.56 | 22.68 | 23.34 | 24.50 | 24.99 |
| Change (%) | -5.78% | -2.51% | -0.53% | - | +2.91% | +8.02% | +10.19% |
| Change | -1.31 | -0.57 | -0.12 | - | +0.66 | +1.82 | +2.31 |
| Level | Minor | Minor | Major | - | Intermediate | Minor | Major |
Pivot points can also be used to set your price objectives. Here is the price situation in relation to pivot points:
| Pivot points | S3 | S2 | S1 | PP | R1 | R2 | R3 |
|---|---|---|---|---|---|---|---|
| Standard | 22.17 | 22.43 | 22.56 | 22.82 | 22.95 | 23.21 | 23.34 |
| Camarilla | 22.58 | 22.62 | 22.65 | 22.69 | 22.73 | 22.76 | 22.80 |
| Woodie | 22.11 | 22.40 | 22.50 | 22.79 | 22.89 | 23.18 | 23.28 |
| Fibonacci | 22.43 | 22.58 | 22.67 | 22.82 | 22.97 | 23.06 | 23.21 |
| Pivot points | S3 | S2 | S1 | PP | R1 | R2 | R3 |
|---|---|---|---|---|---|---|---|
| Standard | 22.83 | 23.29 | 23.59 | 24.05 | 24.35 | 24.81 | 25.11 |
| Camarilla | 23.67 | 23.74 | 23.81 | 23.88 | 23.95 | 24.02 | 24.09 |
| Woodie | 22.74 | 23.25 | 23.50 | 24.01 | 24.26 | 24.77 | 25.02 |
| Fibonacci | 23.29 | 23.58 | 23.76 | 24.05 | 24.34 | 24.52 | 24.81 |
| Pivot points | S3 | S2 | S1 | PP | R1 | R2 | R3 |
|---|---|---|---|---|---|---|---|
| Standard | 18.59 | 19.61 | 21.49 | 22.51 | 24.39 | 25.41 | 27.29 |
| Camarilla | 22.56 | 22.83 | 23.09 | 23.36 | 23.63 | 23.89 | 24.16 |
| Woodie | 19.01 | 19.83 | 21.91 | 22.73 | 24.81 | 25.63 | 27.71 |
| Fibonacci | 19.61 | 20.72 | 21.41 | 22.51 | 23.62 | 24.31 | 25.41 |
Numerical data
The following is the status of the technical indicators and moving averages at the time of publication of this technical analysis:
| RSI (14): | 42.76 | |
| MACD (12,26,9): | 0.0900 | |
| Directional Movement: | -3.64 | |
| AROON (14): | -35.71 | |
| DEMA (21): | 23.45 | |
| Parabolic SAR (0,02-0,02-0,2): | 24.05 | |
| Elder Ray (13): | -0.42 | |
| Super Trend (3,10): | 24.12 | |
| Zig ZAG (10): | 22.70 | |
| VORTEX (21): | 0.9600 | |
| Stochastique (14,3,5): | 4.68 | |
| TEMA (21): | 23.35 | |
| Williams %R (14): | -98.38 | |
| Chande Momentum Oscillator (20): | -1.28 | |
| Repulse (5,40,3): | -3.4300 | |
| ROCnROLL: | 2 | |
| TRIX (15,9): | 0.2100 | |
| Courbe Coppock: | 1.35 |
| MA7: | 23.19 | |
| MA20: | 23.49 | |
| MA50: | 22.54 | |
| MA100: | 22.98 | |
| MAexp7: | 23.10 | |
| MAexp20: | 23.24 | |
| MAexp50: | 22.98 | |
| MAexp100: | 22.75 | |
| Price / MA7: | -2.20% | |
| Price / MA20: | -3.45% | |
| Price / MA50: | +0.62% | |
| Price / MA100: | -1.31% | |
| Price / MAexp7: | -1.82% | |
| Price / MAexp20: | -2.41% | |
| Price / MAexp50: | -1.31% | |
| Price / MAexp100: | -0.31% |
About author
Online


Add a comment
Comments
0 comments on the analysis ACS CONST. - Daily